The Question
Hospital length of stay (LOS) affects how many patients a hospital can serve and how much each stay costs. Understanding what drives longer stays can help identify patterns.
Primary question: What patterns help explain variation in inpatient length of stay?
The Data
Source: CDC National Hospital Care Survey (NHCS)
- Patient-level discharge records from U.S. hospitals
- Includes LOS, diagnosis codes, demographics, discharge disposition
Scope: 173,493 inpatient discharges
Key Measures:
- LOS - Length of stay in days (capped at 15 in source data)
- Discharge Destination - Where patient went after discharge (Home, SNF, ICF, etc.)
- Age Group - Patient age bands
- Diagnosis Category - Derived from primary ICD-10 code
Key Findings
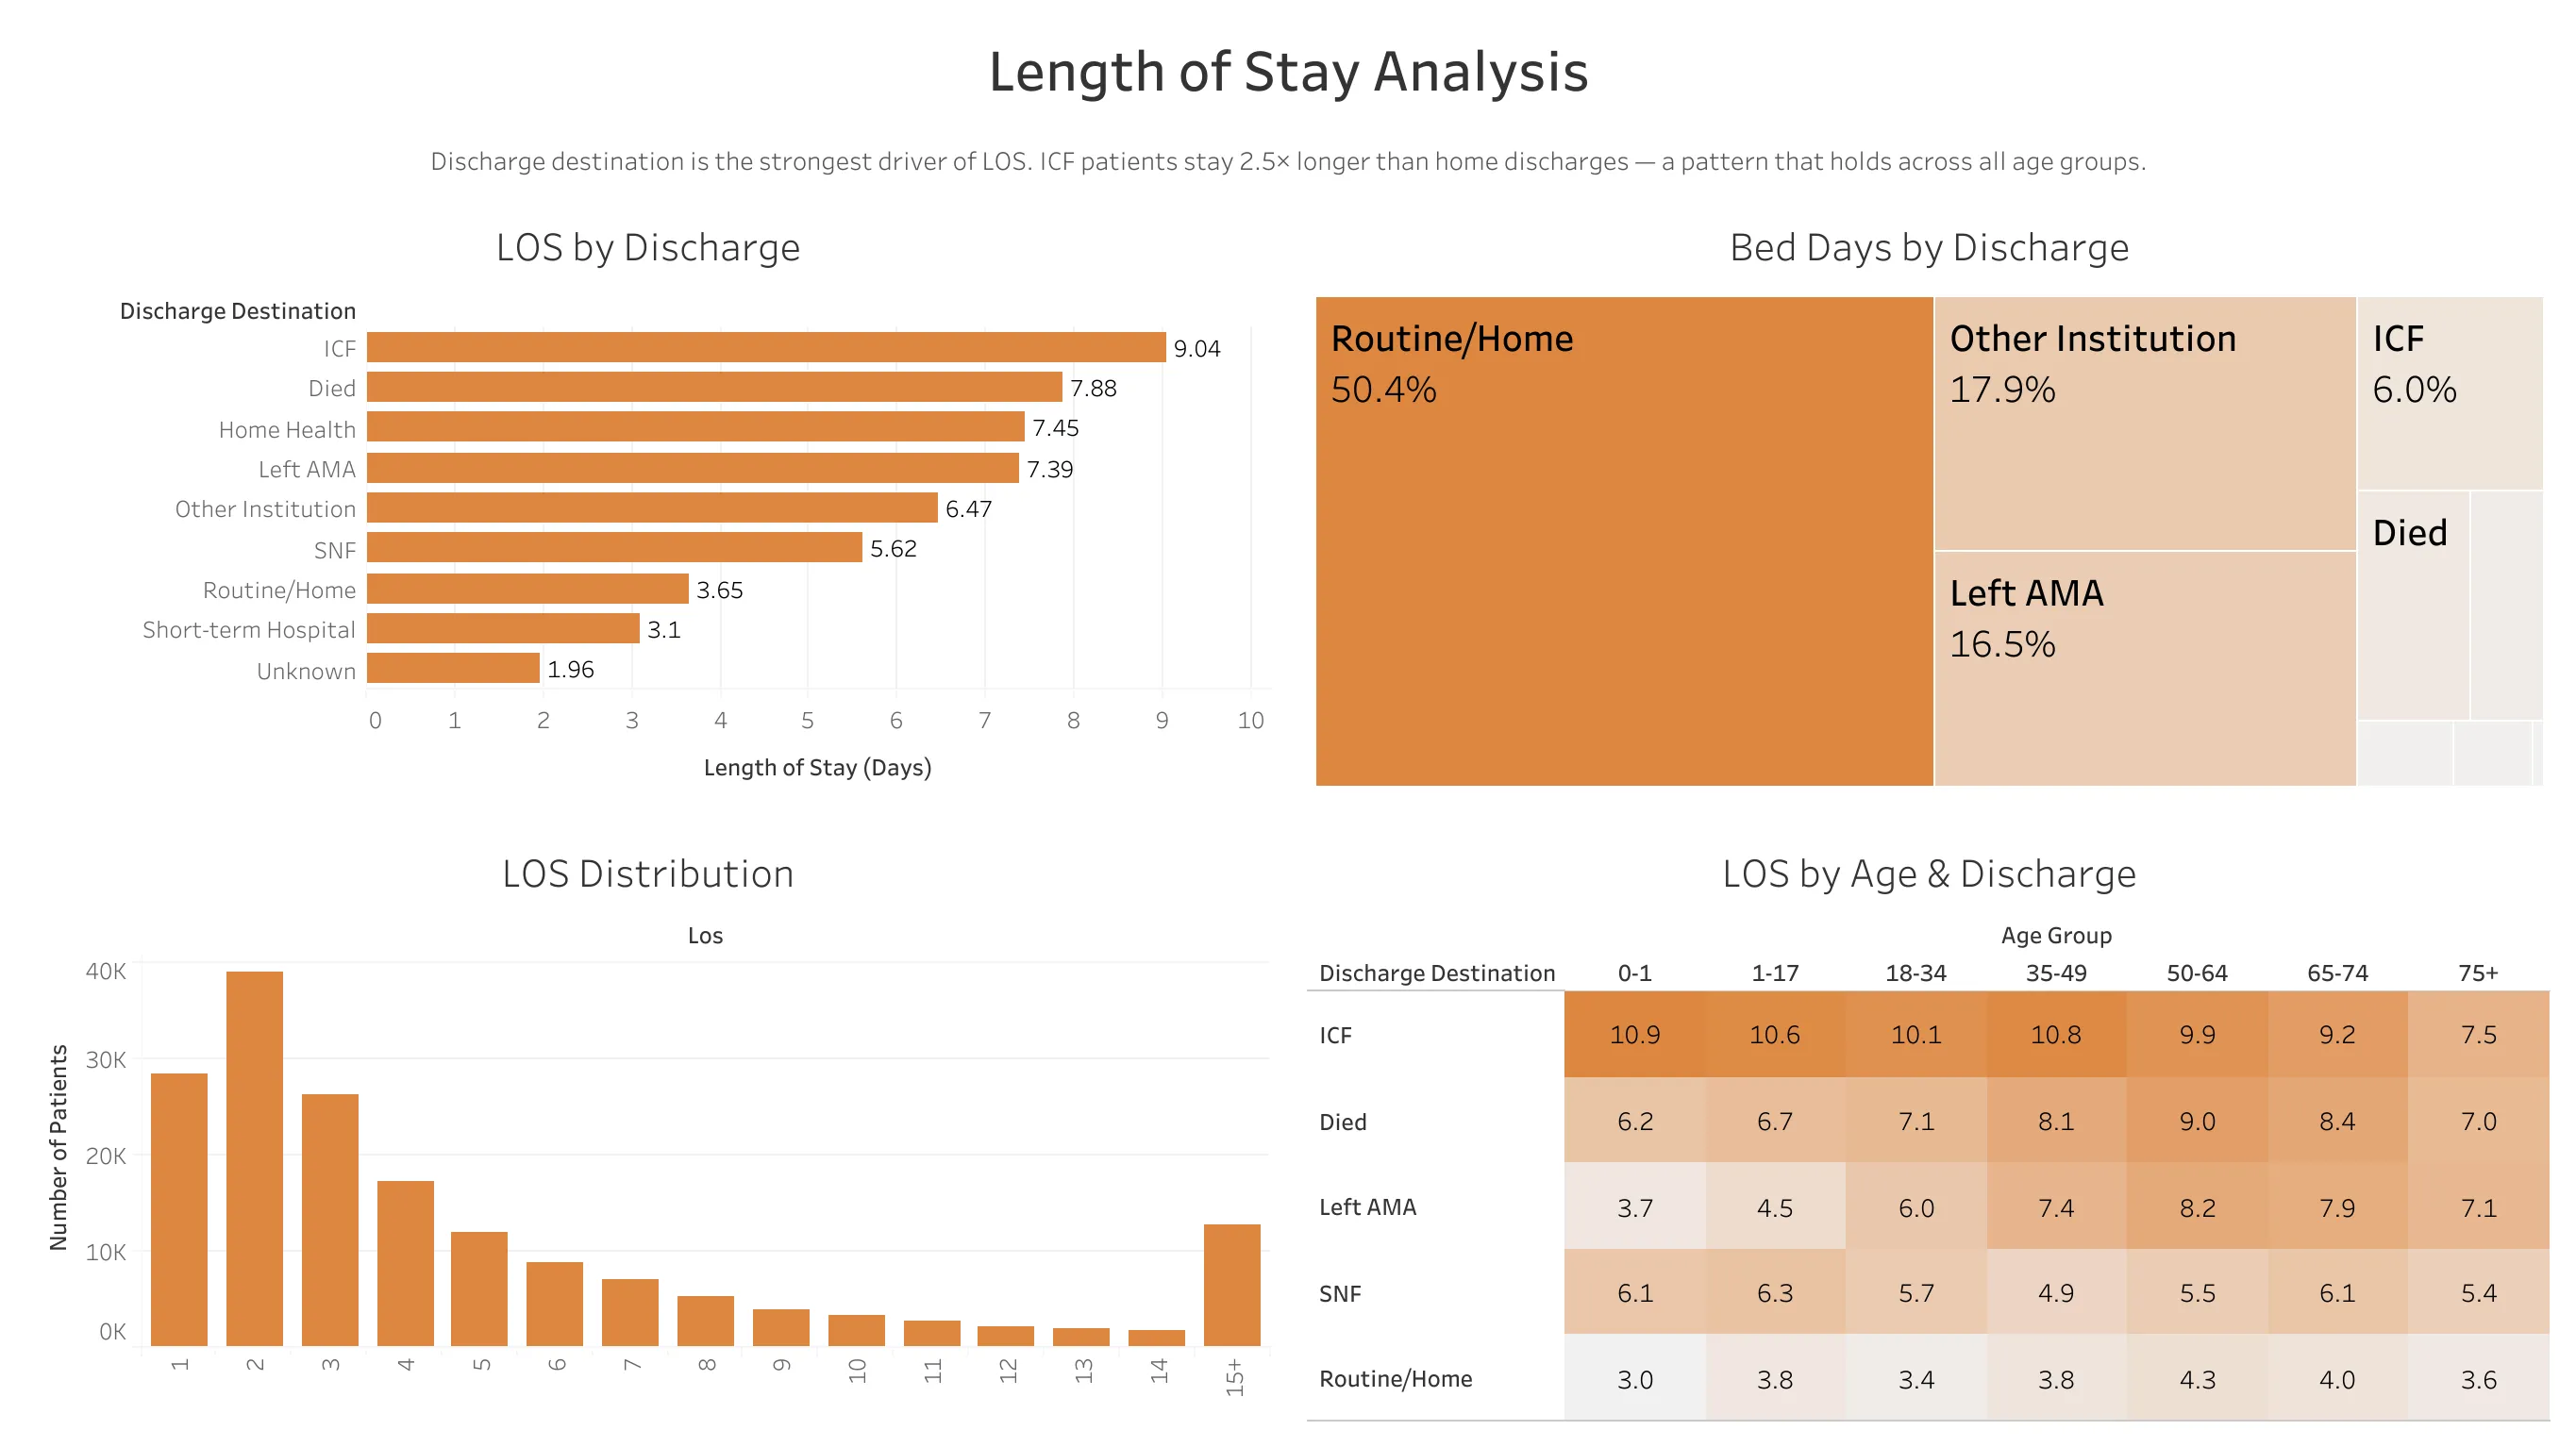
1. Discharge Destination Has the Largest LOS Variation
Where a patient goes after discharge shows the biggest differences in LOS:
| Destination | Avg LOS | vs Home |
|---|---|---|
| ICF (Intermediate Care Facility) | 9.04 days | +5.4 days |
| Died | 7.88 days | +4.2 days |
| Home Health | 7.45 days | +3.8 days |
| Left AMA | 7.39 days | +3.7 days |
| SNF (Skilled Nursing Facility) | 5.62 days | +2.0 days |
| Routine/Home | 3.65 days | baseline |
Patients discharged to ICF stay 2.5x longer than those discharged home.
2. Volume vs. Average: Bed-Days Tell a Different Story
Average LOS shows where patients stay longest. But total bed-days consumed (LOS × number of discharges) shows where capacity actually goes:
| Destination | Avg LOS | % of Total Bed-Days |
|---|---|---|
| Routine/Home | 3.65 days | 50.4% |
| Other Institution | 6.47 days | 17.9% |
| Left AMA | 7.39 days | 16.5% |
| ICF | 9.04 days | 6.0% |
Home discharges consume half of all bed capacity despite having the shortest stays. This is a volume effect: there are far more home discharges than ICF discharges.
3. Right-Skewed Distribution
The LOS distribution shows classic right skew:
- Peak at day 2 (~39,000 patients)
- Rapid decline through days 3-7
- Long tail extending to 15+ days
Most patients leave quickly, but a subset of extended stays pulls up the average.
4. The Pattern Holds Across Age Groups
One might expect that ICF patients stay longer simply because they’re older. Breaking it down by age group shows the pattern holds regardless of age:
| Age Group | ICF Avg LOS | Home Avg LOS | Ratio |
|---|---|---|---|
| 0-1 | 10.9 days | 3.0 days | 3.6x |
| 18-34 | 10.1 days | 3.4 days | 3.0x |
| 35-49 | 10.8 days | 3.8 days | 2.8x |
| 75+ | 7.5 days | 3.6 days | 2.1x |
ICF patients stay longest in every age group. Discharge destination matters regardless of patient age.
5. Left AMA Patients Stay Longer Than Expected
Patients who leave against medical advice average 7.39 days before leaving. This is longer than SNF discharges (5.62 days) and close to patients who died (7.88 days).
These patients stayed for almost a week of care before deciding to leave.
Observations
Based on the patterns in this data:
-
Discharge destination matters more than age. The destination a patient goes to after discharge shows more LOS variation than age group alone.
-
Volume drives capacity consumption. Even though ICF patients stay longest, home discharges consume half of all bed-days simply because there are so many more of them.
-
The distribution is skewed. Most patients leave within a few days, but a smaller group of extended stays pulls up the average. The “tail” of the distribution is where the longest stays occur.
-
AMA patients don’t leave early. Patients who leave against medical advice average over 7 days before leaving, which is longer than many other discharge types.
Limitations
- Survey data: NHCS is a sample of hospitals, not a census. Results are weighted but may not perfectly represent all U.S. hospitals.
- LOS capped at 15: Very long stays are truncated, which underestimates the true tail.
- No cost data: This analysis covers LOS only, not charges or payments.
- No hospital characteristics: Can’t segment by hospital size, type, or region.
- Simplified data: CDC data is less detailed than hospital EHR systems.
- Snapshot analysis: Single time period, no trend analysis.
Methodology
Data Processing:
- Converted NHCS Stata (.dta) file to CSV using pandas
- Imported into PostgreSQL
- Created derived fields for diagnosis category (from ICD-10) and age groups
- Filtered to inpatient discharges only
Analysis:
- Aggregated LOS by discharge destination, diagnosis, age group
- Calculated bed-days consumed (LOS × discharge count) for capacity view
- Broke down discharge destination by age group to check if age explains the pattern
- Distribution analysis to characterize LOS shape