The Question
Hospital readmissions within 30 days of discharge are a key quality metric tracked by CMS. For certain conditions like heart failure, hospitals face financial penalties for excess readmissions.
Primary question: What patient characteristics are associated with higher 30-day readmission rates in a heart failure cohort?
The Data
Source: Synthea synthetic EHR data
- Realistic patient records with EHR-like structure
- Industry-standard for demonstrating healthcare data skills without HIPAA concerns
Scope: 1,197 heart failure patients with 4,949 inpatient admissions
Cohort Definition: Patients with at least one condition record for heart failure (SNOMED code 88805009) and at least one inpatient encounter with a recorded discharge date.
Key Measures:
- Readmit 30-Day Flag - 1 if patient returned within 30 days of discharge, 0 otherwise
- Days to Readmission - Calendar days between discharge and next admission
- Admission Number - Sequential count of patient’s admissions (1st, 2nd, 3rd, etc.)
- Condition Count - Total distinct conditions on record for patient
- Age Group - Patient age at admission (18-49, 50-64, 65-74, 75-84, 85+)
Key Findings
1. Overall Readmission Rate
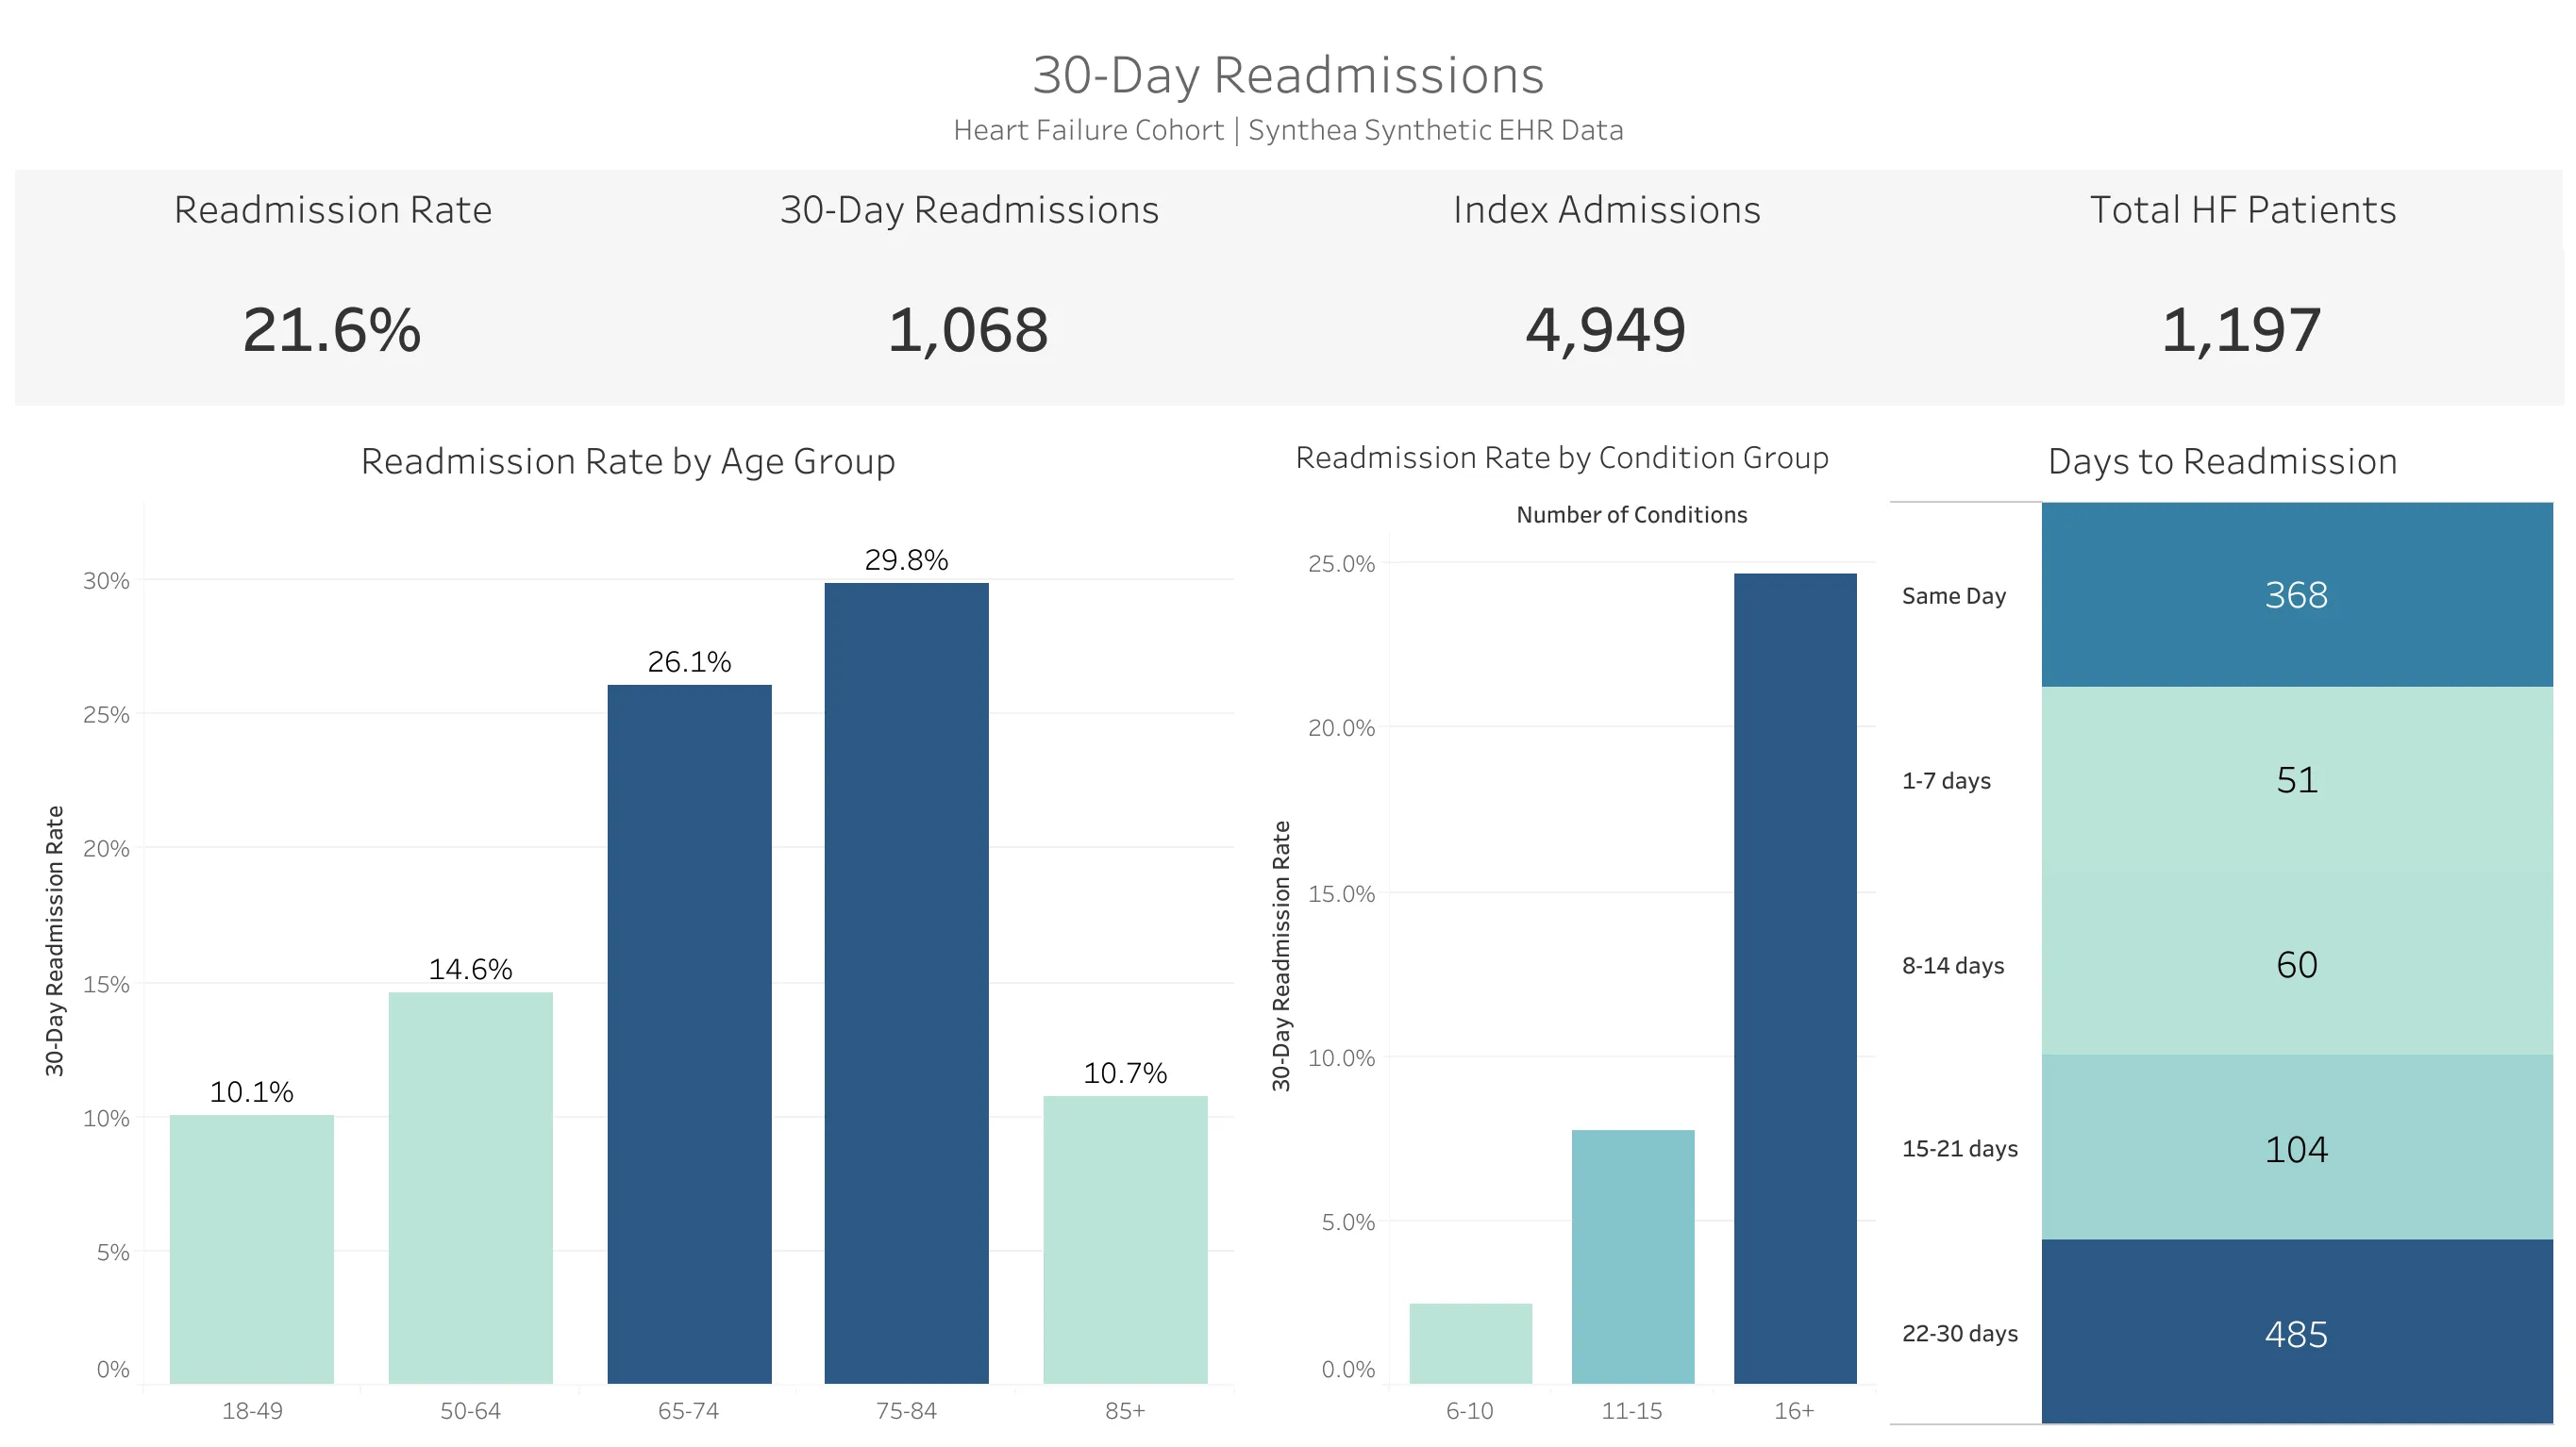
The 30-day readmission rate for the heart failure cohort is 21.6% (1,068 readmissions out of 4,949 index admissions). Roughly 1 in 5 discharges results in a return within 30 days.
2. Age Group Breakdown
Readmission rates vary by age group:
| Age Group | Admissions | Readmission Rate |
|---|---|---|
| 18-49 | 476 | 10.1% |
| 50-64 | 1,354 | 14.6% |
| 65-74 | 862 | 26.1% |
| 75-84 | 1,856 | 29.9% |
| 85+ | 401 | 10.7% |
The 75-84 age group has the highest rate at nearly 30%. The drop-off at 85+ is notable and would be worth investigating with additional data.
3. Condition Count
Patients with more conditions on record have higher readmission rates:
| Condition Count | Readmission Rate |
|---|---|
| 6-10 | 3.5% |
| 11-15 | 13.4% |
| 16+ | 24.1% |
No patients in the cohort had fewer than 6 conditions - heart failure patients tend to have multiple health issues. Those with 16+ conditions are readmitted at a much higher rate.
4. Prior Admissions
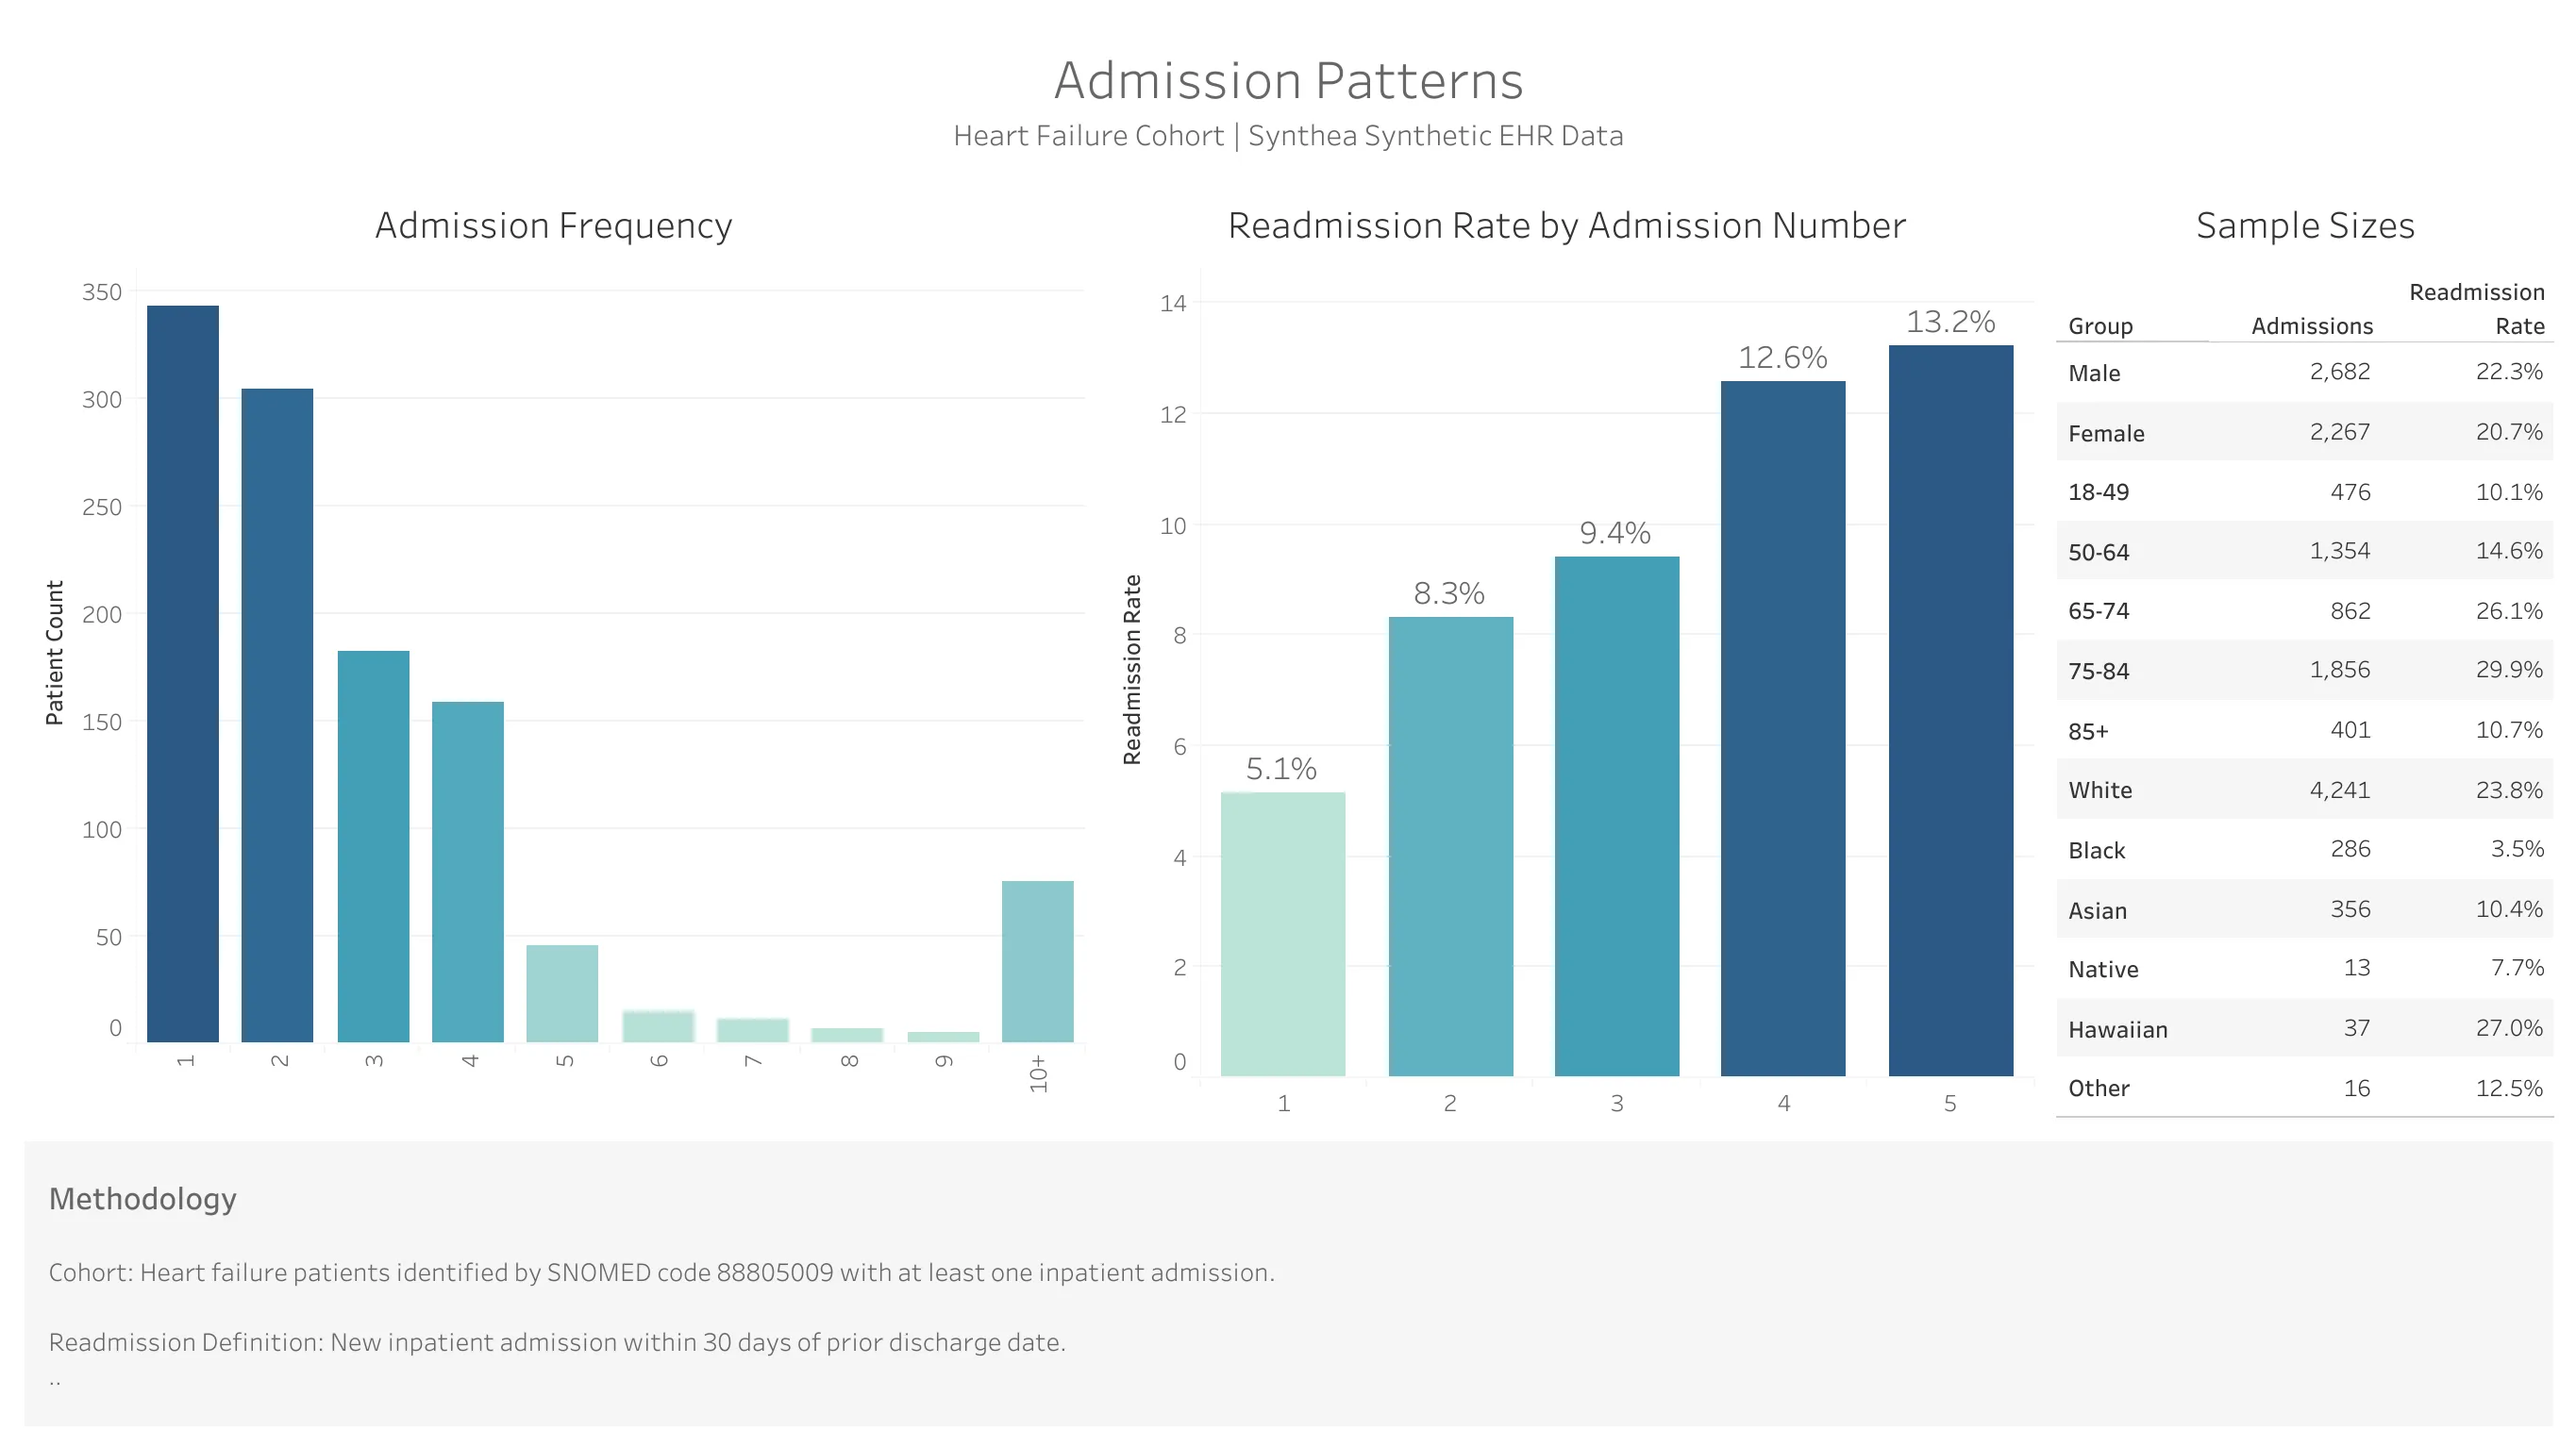
Readmission rate increases with each subsequent admission:
| Admission Number | Readmission Rate |
|---|---|
| 1st admission | 5.1% |
| 2nd admission | 8.3% |
| 3rd admission | 9.4% |
| 4th admission | 12.6% |
| 5th admission | 13.2% |
Patients who have already been readmitted are more likely to be readmitted again.
5. Days to Readmission
The distribution of days to readmission showed some unexpected patterns:
| Window | Readmissions |
|---|---|
| Same Day | 368 |
| 1-7 days | 51 |
| 8-14 days | 60 |
| 15-21 days | 104 |
| 22-30 days | 485 |
Same-day returns (34% of all readmissions) likely represent overlapping encounters in the synthetic data rather than true clinical patterns.
Observations
Based on the patterns in this data:
-
Age and condition count both correlate with higher readmission rates. The 65-84 age group and patients with 16+ conditions have the highest rates.
-
Prior admission history matters. Patients who have been readmitted before are more likely to be readmitted again, suggesting some patients cycle through repeatedly.
-
Data anomalies are visible. The same-day readmission spike and the unusual 22-30 day pattern would warrant further investigation with real data.
Limitations
- Synthetic data: Synthea generates realistic patterns but is not real patient data. Some anomalies may reflect how the data was generated.
- Simplified data: Synthea is less detailed than production EHR systems.
- Single condition cohort: This focuses on heart failure only. Patterns may differ for other conditions.
- Snapshot analysis: This is a point-in-time view. Trends over time aren’t captured.
Methodology
Exploratory Data Analysis (Python):
- Loaded Synthea CSVs with pandas for initial exploration
- Checked data quality: missing values, data types, distributions
- Previewed heart failure cohort size and admission patterns
- Visualized age distribution and encounter types with matplotlib/seaborn
Data Processing (SQL):
- Created PostgreSQL database and imported Synthea CSV files (patients, encounters, conditions)
- Built heart failure cohort using SNOMED code 88805009
- Used LEAD() window function to identify next admission date for each patient
- Calculated 30-day readmission flag based on days between discharge and next admission
- Created age groups and condition count buckets for analysis
Analysis:
- Aggregated readmission rates by age group, condition count, and admission number
- Calculated admission frequency distribution by patient
- Analyzed days to readmission distribution to identify patterns