TidyTrek is a full-featured web application I built for backpackers to organize gear, track pack weights, and share lists with the community. It includes pack management with drag-and-drop reordering, a personal gear library, real-time analytics, social features, and a subscription system. But at its core, it’s a data system—the schema design, aggregation logic, and performance tradeoffs are where things get interesting.
The challenge was designing a system that helps users understand tradeoffs—pack weight vs. comfort, base weight vs. total weight, cost vs. performance. Every schema decision and query pattern below was driven by what users needed to see and act on.
This case study walks through four of those patterns:
- Hierarchical data modeling with aggregations
- Polymorphic schema design for flexible data types
- Time-series analytics with SQL window functions
- Fractional indexing for efficient list ordering
1. Pack Dashboard: Hierarchical Data with Real-Time Aggregations
The Problem
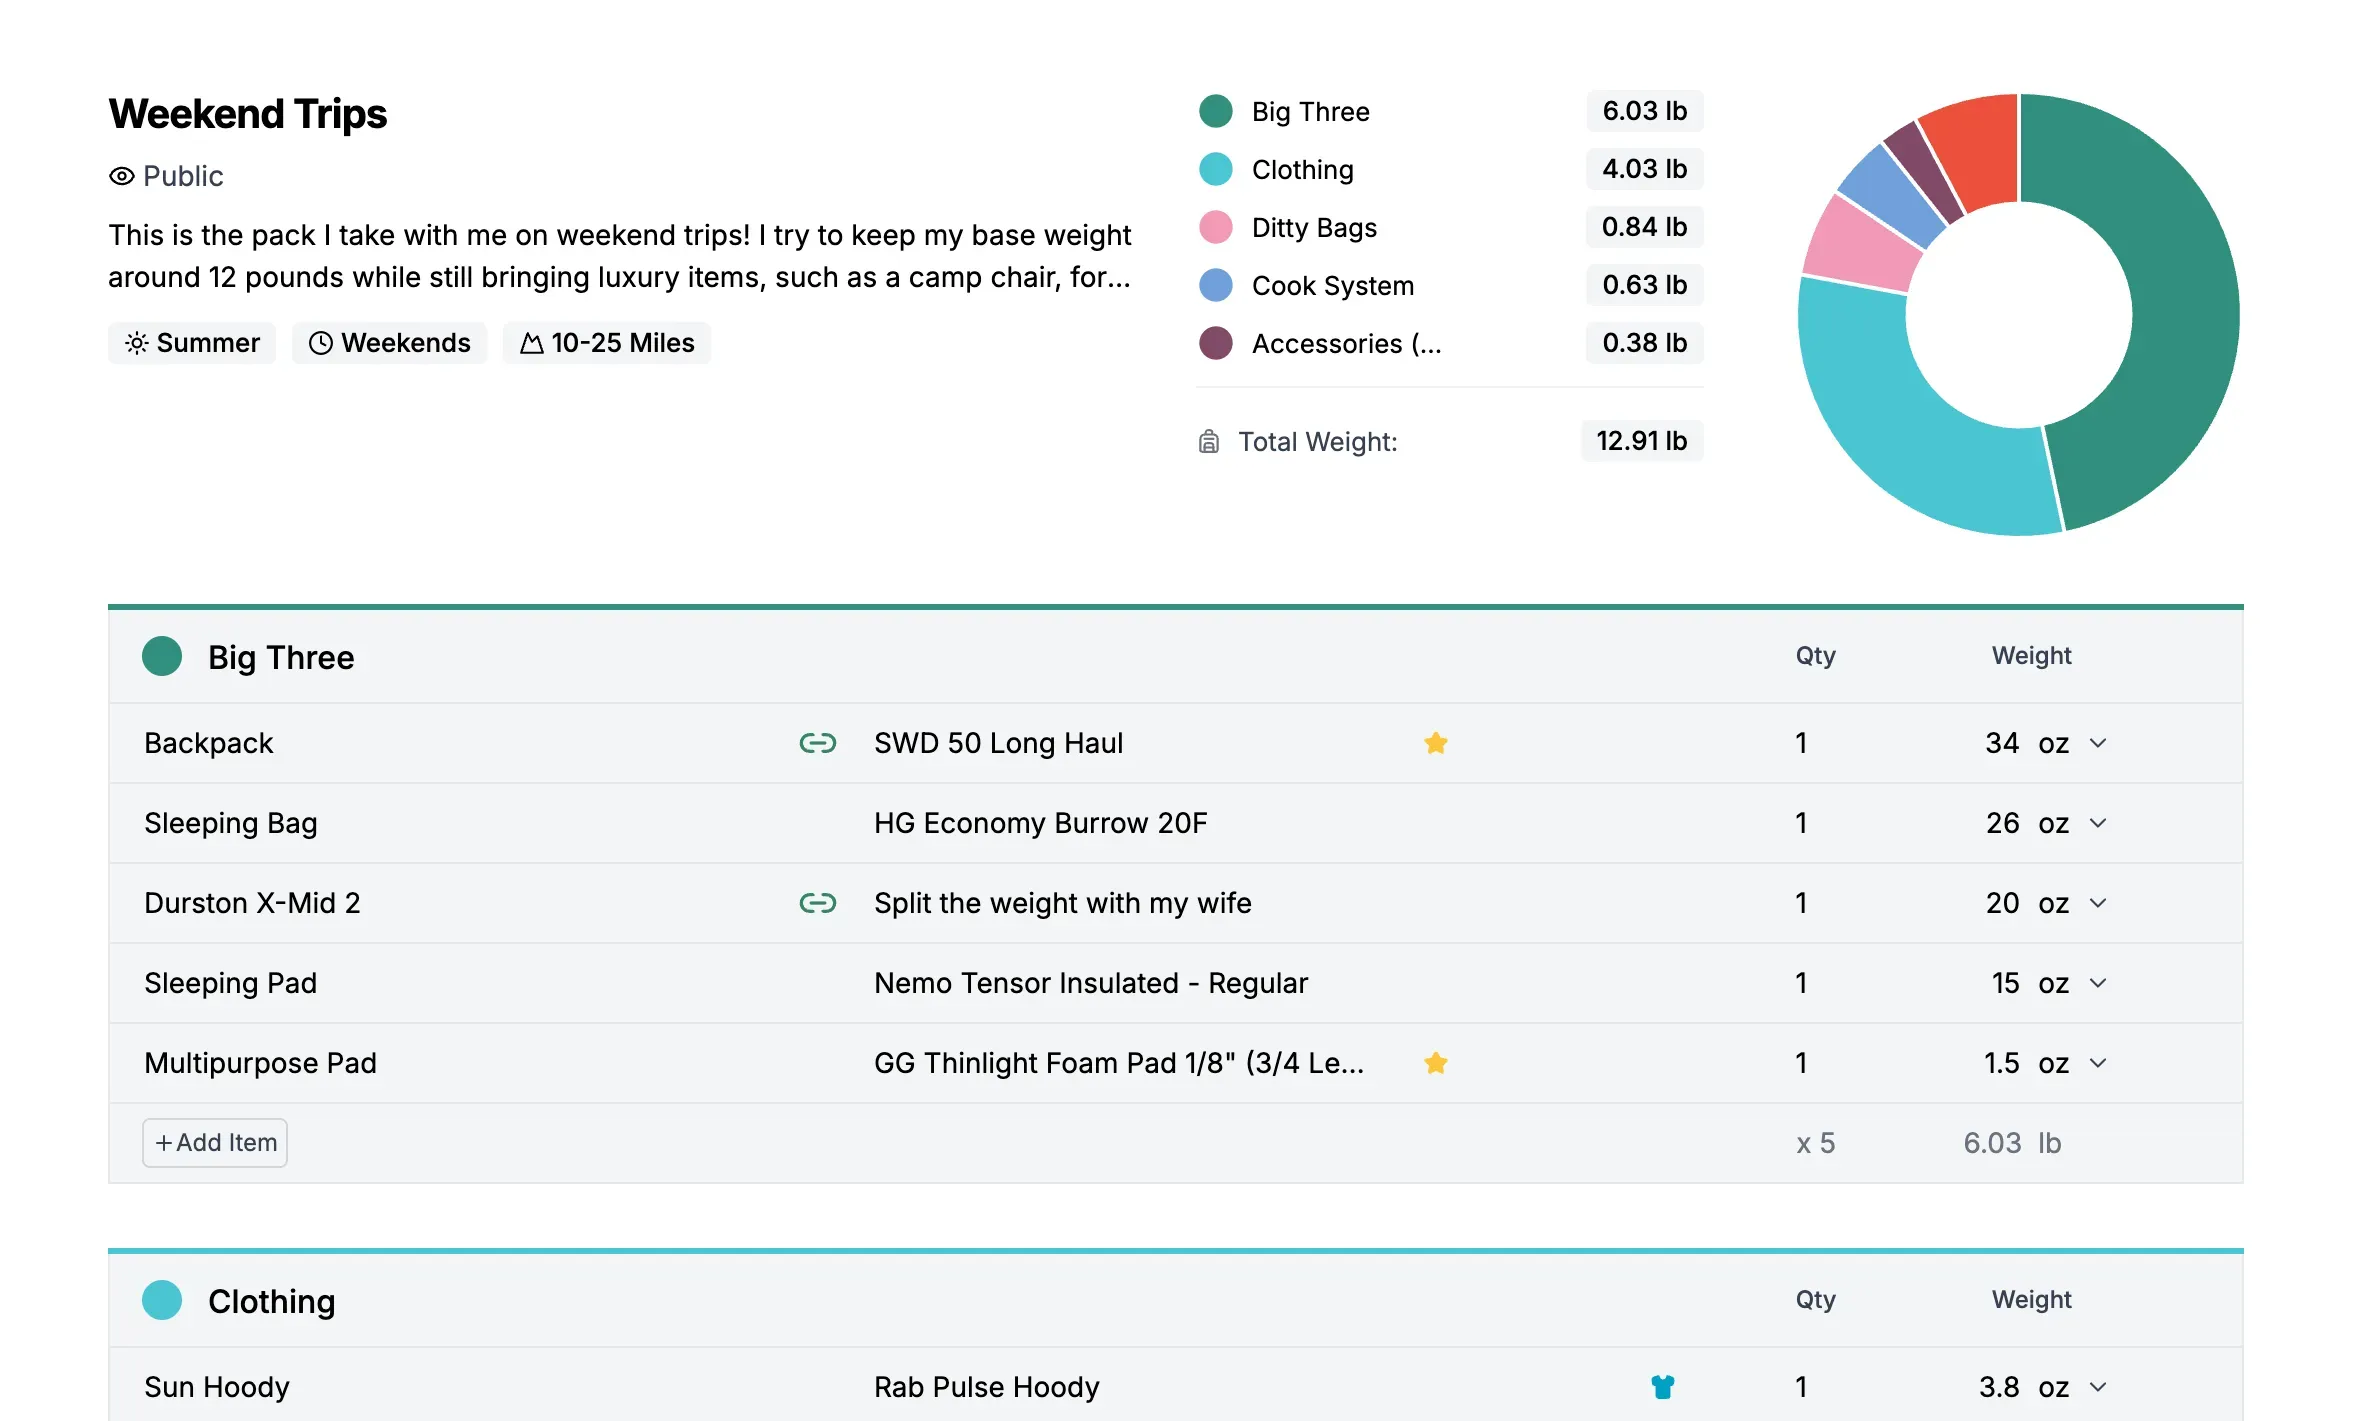
Users need to organize hundreds of gear items across multiple packs. Each item has a weight (in different units), a price, and classification flags. The dashboard shows aggregated statistics—total weight, base weight, worn weight, consumables, and cost—that update as items change.
The Data Model
The schema uses a three-level hierarchy:
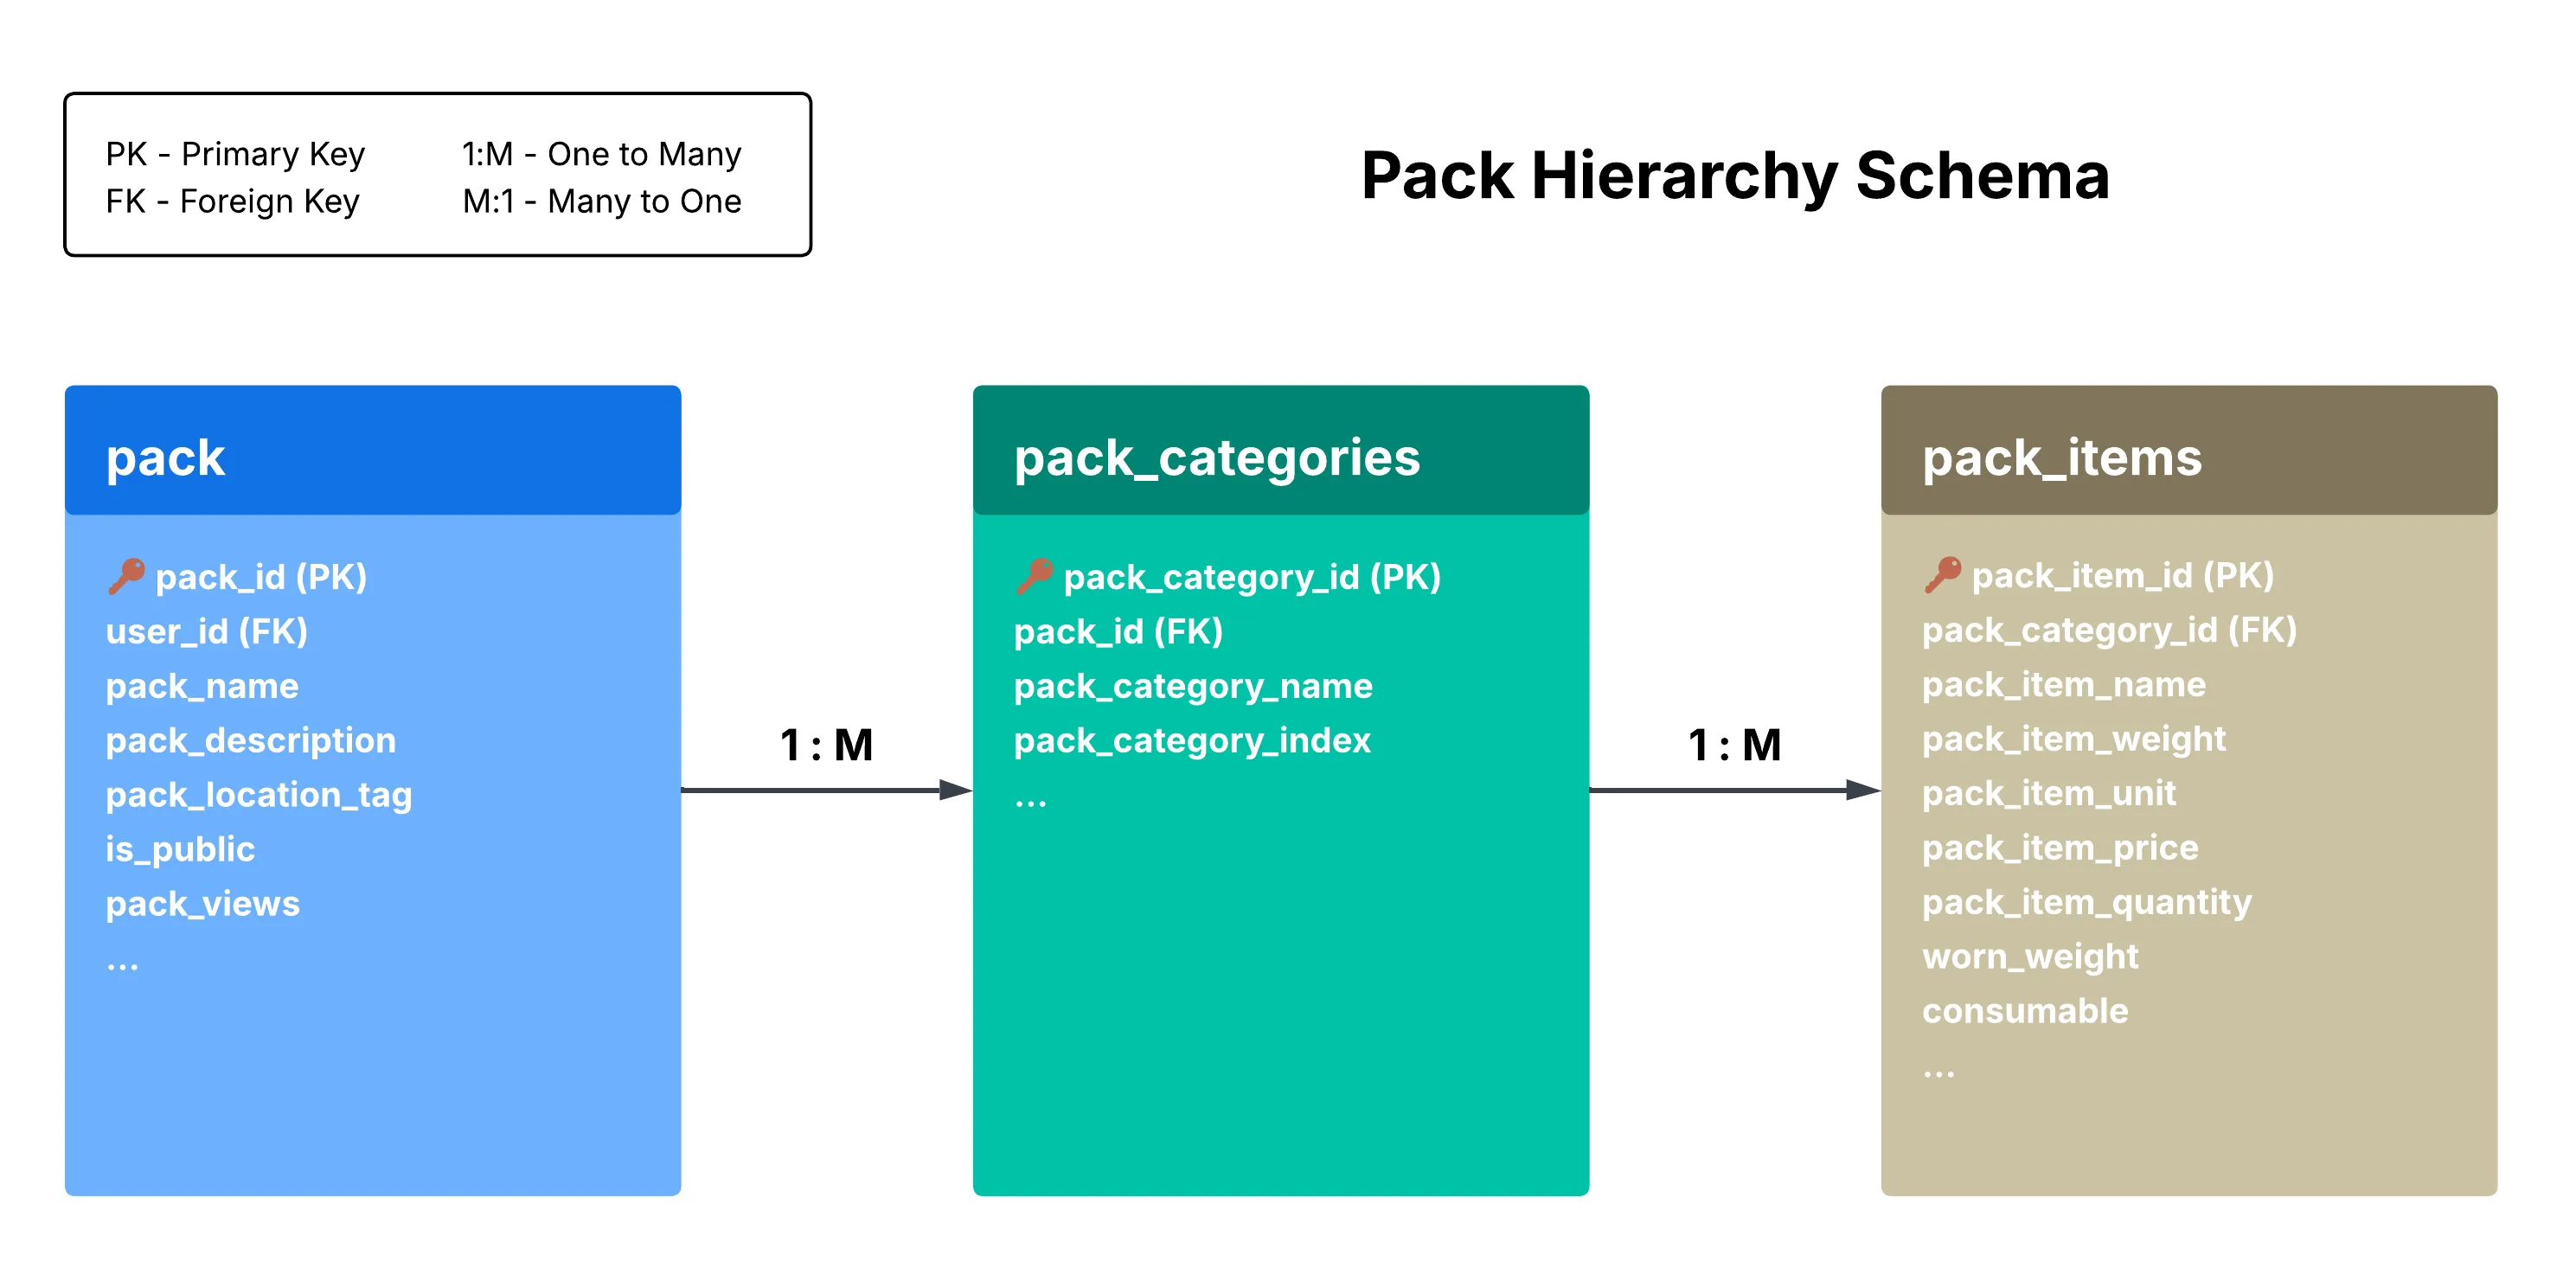
This hierarchy matches how users think about their gear: “My Weekend Pack has a Big Three category, which contains my tent, sleeping bag, and backpack.”
Aggregation Logic
The dashboard calculates four weight metrics from the item data:
totalWeight = sum of all items (converted to display unit)
wornWeight = sum of items where worn_weight = true
consumableWeight = sum of items where consumable = true
baseWeight = totalWeight - wornWeight - consumableWeight
Unit conversion adds complexity. Each item stores its weight in whatever unit the user entered—a 3.2 oz headlamp, a 2 lb tent, a 1 kg sleeping bag. The aggregation logic needs to handle mixed units and convert everything to the user’s preferred display unit.
const totalWeight = items.reduce((sum, item) => {
  const itemWeight = item.packItemWeight * item.packItemQuantity;
  const converted =
    item.packItemWeightUnit === displayUnit
      ? itemWeight
      : convertToUnit(itemWeight, item.packItemWeightUnit, displayUnit);
  return sum + converted;
}, 0);
Conversion happens at aggregation time, not storage time—preserving the original data and keeping the unit dropdown in sync with what users entered.
Why This Matters
Store data at the lowest level of granularity (individual items), then aggregate up.
2. Polymorphic Pack Types: One Table, Multiple Use Cases
The Problem
The application needed to support three different types of “packs”:
- User packs — Trip-specific gear lists (e.g., “JMT Thru-Hike 2026”)
- Gear closet — A personal library of all owned gear
- Shakedown snapshots — Point-in-time copies for community feedback
The naive approach would be three separate tables. But all three share the same structure: packs contain categories, categories contain items.
The Solution
A single pack table with a pack_type discriminator column:
-- pack table (simplified)
pack_id SERIAL PRIMARY KEY,
user_id UUID REFERENCES users(user_id),
pack_name VARCHAR(100),
pack_type VARCHAR(20) CHECK (pack_type IN ('user', 'gear-closet', 'shakedown')) NOT NULL DEFAULT 'user'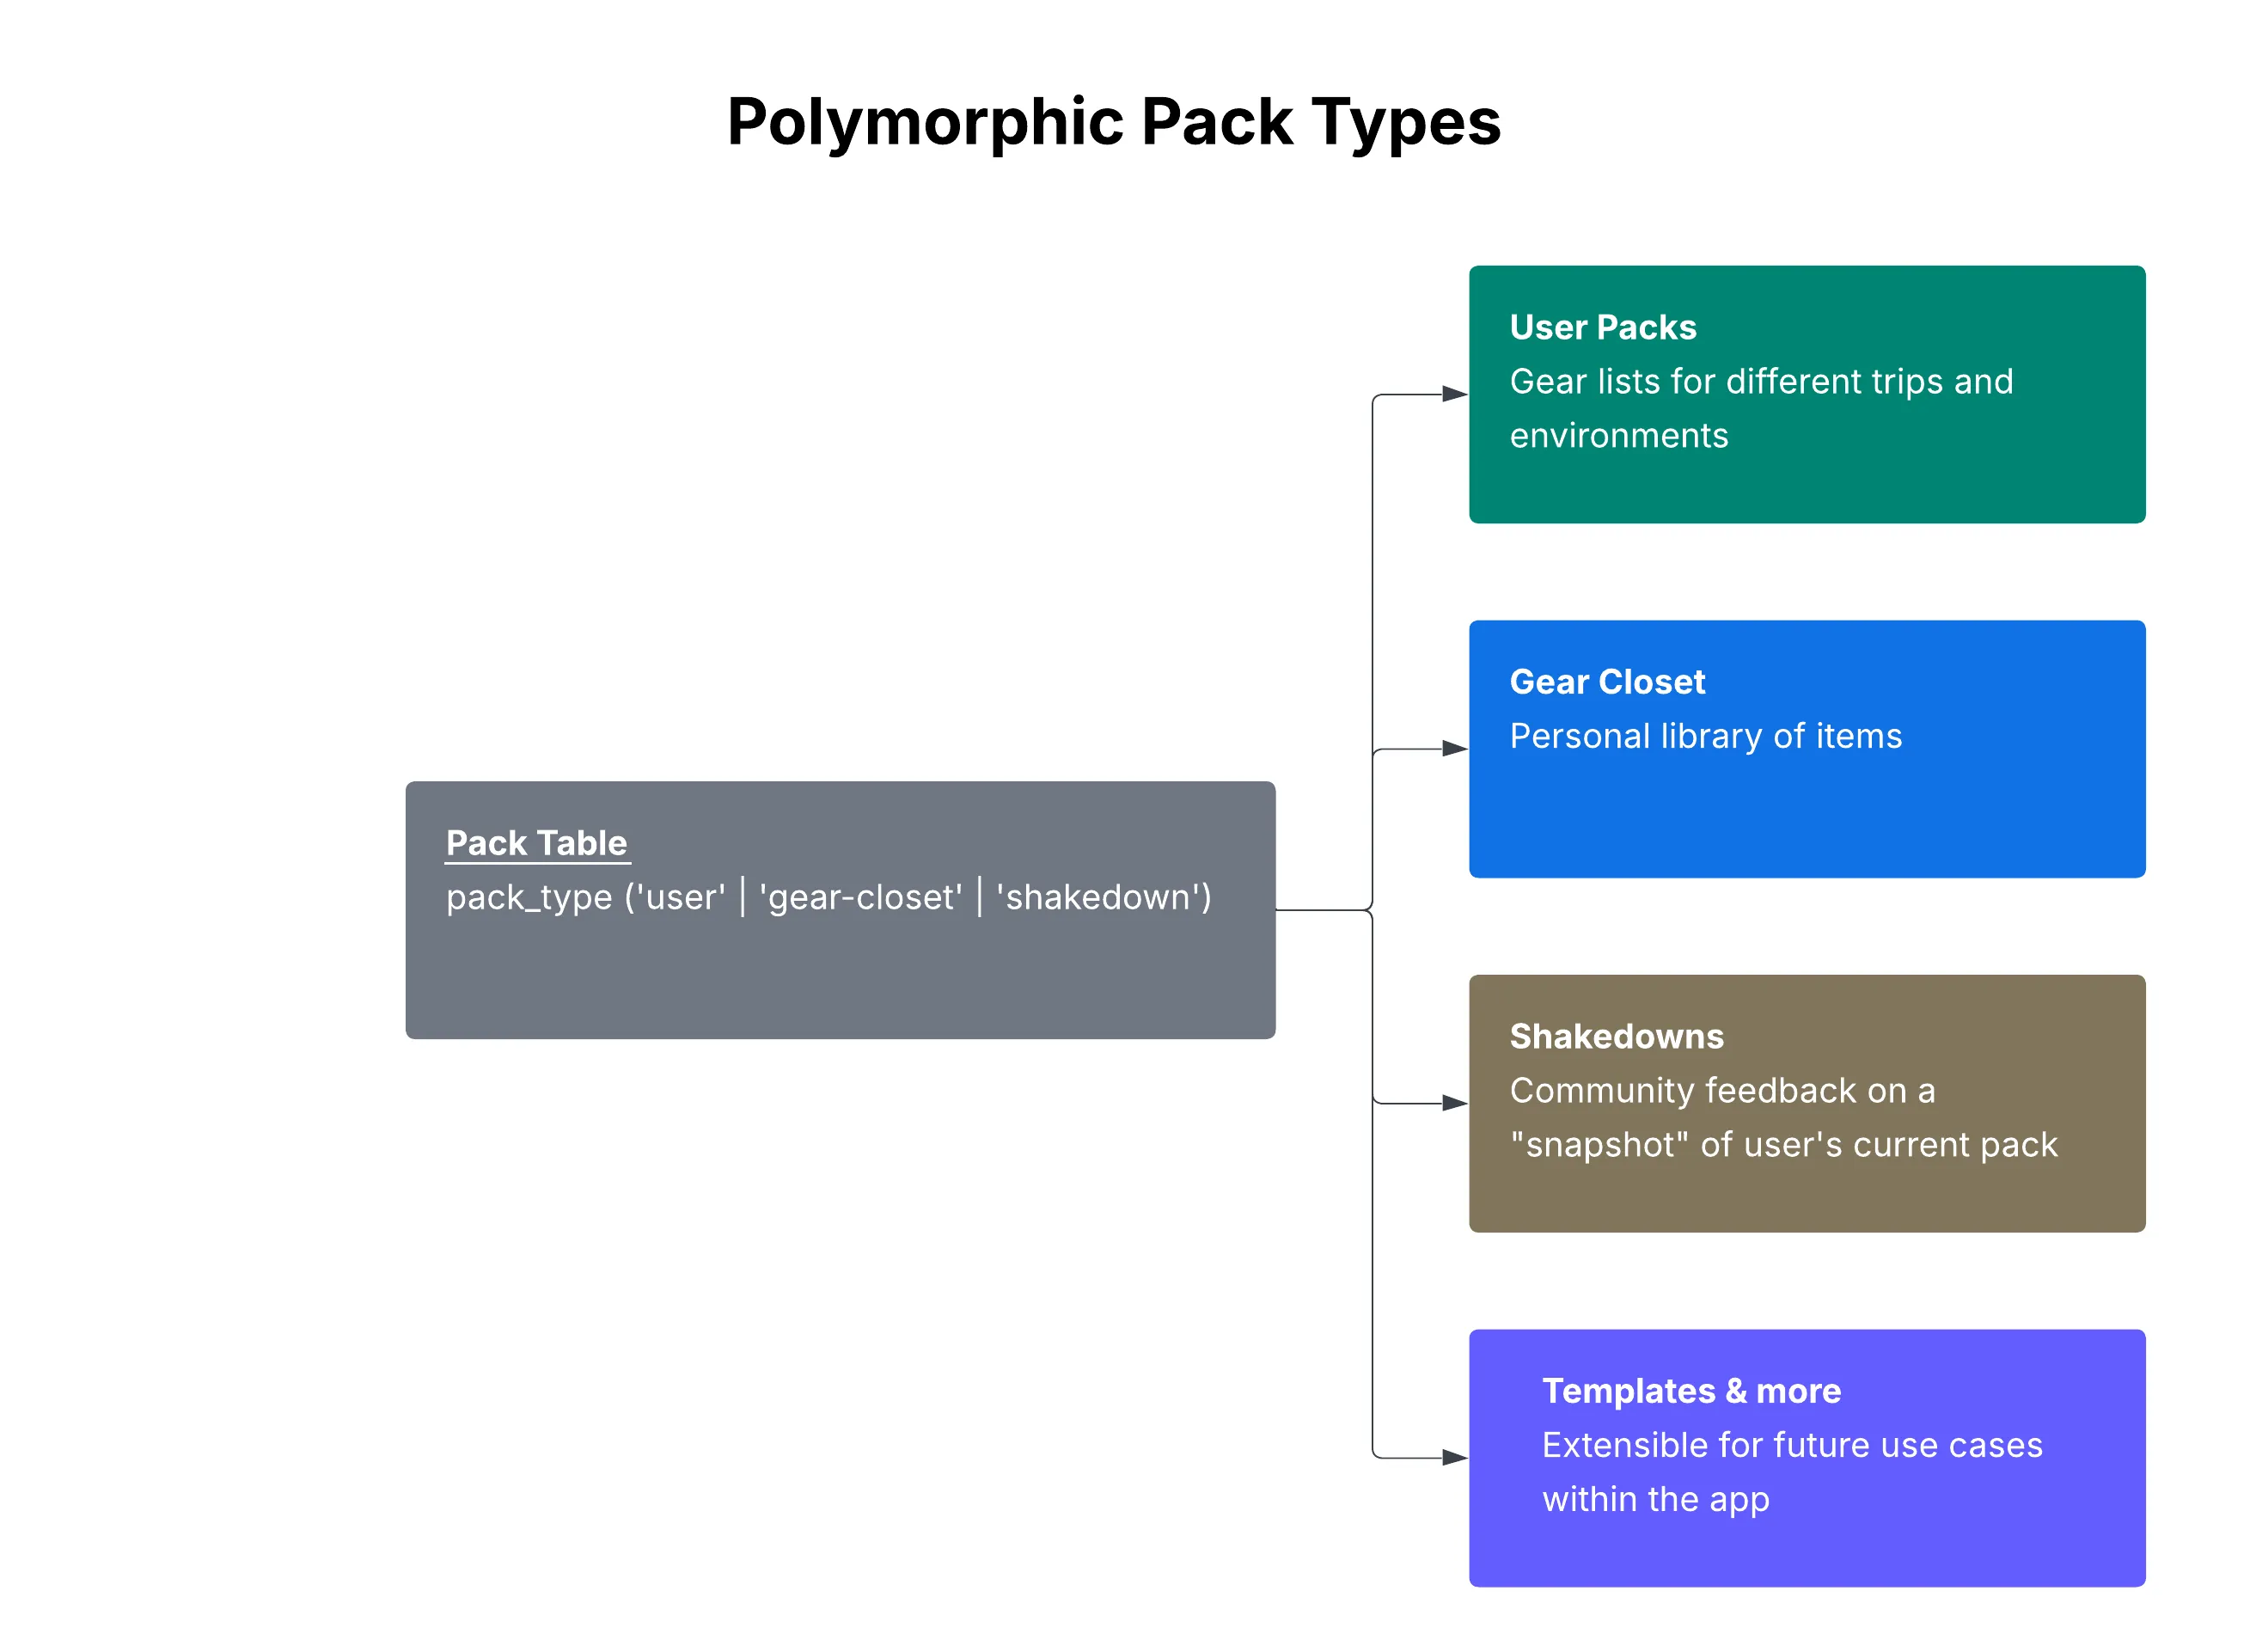
Why Polymorphic Over Separate Tables?
Shared structure: All three types use the same Pack → Category → Item hierarchy. Creating three parallel table structures would mean tripling the schema and all the queries.
Shared queries: Weight aggregation, item counts, CSV exports—they all work identically regardless of pack type. One function serves all three use cases.
Single source of truth: One set of constraints, indexes, and foreign key relationships. Adding a new pack type is just a new enum value, not a migration.
Extensible: Adding a new pack type requires only a new enum value and any feature-specific metadata tables—no changes to the core schema.
When Separate Tables Would Be Better
This pattern isn’t universal. Separate tables make sense when:
- Schema diverges significantly between types (different columns needed)
- Query patterns are completely different
- Access control rules differ fundamentally
- Types need independent scaling
For TidyTrek, the shared structure outweighed these concerns. A user’s gear closet and their trip packs are fundamentally the same data shape—just used differently.
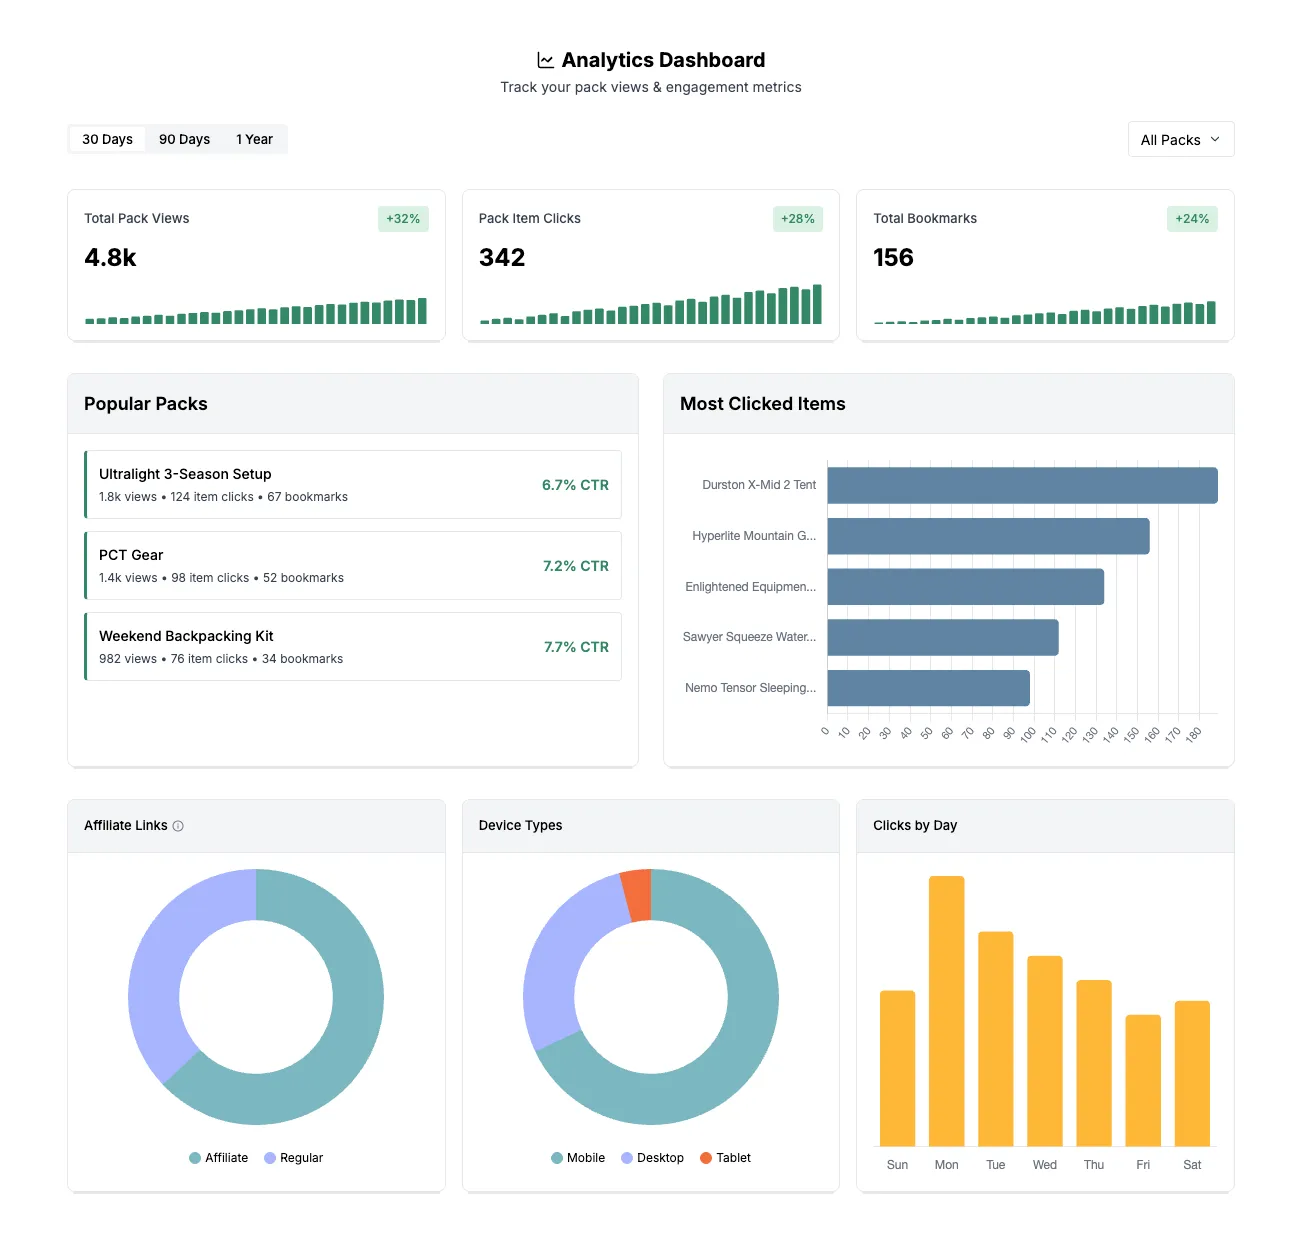
3. Analytics Dashboard: Time-Series Queries
The Problem
Pack owners wanted to understand engagement over time: How many views this month? Is engagement trending up or down? Which packs perform best?
This required time-series data with date range filtering and trend calculations.
The Schema
CREATE TABLE analytics_events (
  event_id SERIAL PRIMARY KEY,
  event_type VARCHAR(50) NOT NULL,  -- 'pack_view', 'pack_click', 'pack_item_click', 'bookmark'
  user_id UUID REFERENCES users(user_id),
  pack_id INTEGER REFERENCES pack(pack_id),
  pack_item_id INTEGER REFERENCES pack_items(pack_item_id),
  is_affiliate BOOLEAN DEFAULT FALSE,
  device_type VARCHAR(20),          -- 'mobile', 'desktop', 'tablet'
  created_at TIMESTAMP DEFAULT NOW()
);

-- Indexes for time-series queries
CREATE INDEX idx_analytics_user_date ON analytics_events(user_id, created_at);
CREATE INDEX idx_analytics_pack_date ON analytics_events(pack_id, created_at);
CREATE INDEX idx_analytics_type_date ON analytics_events(event_type, created_at);
The compound indexes are critical. Without them, queries filtering by user AND date range would scan the entire table.
Query Patterns
Time-series with date range:
SELECT DATE(created_at) as date, COUNT(*) as views
FROM analytics_events
WHERE event_type = 'pack_view'
  AND user_id = $1
  AND created_at >= NOW() - INTERVAL '30 days'
GROUP BY DATE(created_at)
ORDER BY date ASC;
This returns daily view counts for the past 30 days—ready for a line chart.
Percentage change with Common Table Expressions:
WITH current_period AS (
  SELECT COUNT(*) as current_count
  FROM analytics_events
  WHERE user_id = $1
    AND event_type = 'pack_view'
    AND created_at >= NOW() - INTERVAL '30 days'
),
previous_period AS (
  SELECT COUNT(*) as previous_count
  FROM analytics_events
  WHERE user_id = $1
    AND event_type = 'pack_view'
    AND created_at >= NOW() - INTERVAL '60 days'
    AND created_at < NOW() - INTERVAL '30 days'
)
SELECT
  current_count,
  previous_count,
  CASE WHEN previous_count = 0 THEN 0
       ELSE ROUND(((current_count - previous_count)::numeric / previous_count) * 100, 1)
  END as percentage_change
FROM current_period, previous_period;
Compare current 30 days to previous 30 days, calculate percentage change, handle the divide-by-zero edge case.
Concurrent query execution:
The dashboard needs nine different metrics. Running them sequentially would be slow. Instead:
const [views, clicks, bookmarks, trends, topPacks, ...rest] = await Promise.all(
  [
    getPackViews(userId, range),
    getPackClicks(userId, range),
    getBookmarks(userId, range),
    getTrendData(userId, range),
    getTopPerformingPacks(userId, range),
    // ... more queries
  ],
);
Each query runs in parallel. Total time = slowest query, not sum of all queries.
4. Fractional Indexing: Efficient List Ordering
The Problem
Users drag-and-drop items to reorder their pack lists. The naive approach: store integer positions (1, 2, 3…) and update every item’s position on each move.
With 50+ items per pack and frequent reordering, this creates O(n) database writes per drag operation. Not terrible, but unnecessary.
The Algorithm
Instead of integers, use floating-point positions:
// Items at positions: 1000, 2000, 3000

// Insert between 1000 and 2000:
newPosition = (1000 + 2000) / 2; // = 1500
// Result: 1000, 1500, 2000, 3000

// Insert between 1500 and 2000:
newPosition = (1500 + 2000) / 2; // = 1750
// Result: 1000, 1500, 1750, 2000, 3000

// Insert at beginning (before 1000):
newPosition = 1000 / 2; // = 500
// Result: 500, 1000, 1500, 1750, 2000, 3000
Only one row updated per reorder operation instead of N rows.
The Rebalancing Problem
After many insertions, positions get very precise:
1500.00000001, 1500.00000002, 1500.00000003...Eventually you run out of precision. The solution: detect when positions get too granular and rebalance the entire list:
const REBALANCE_THRESHOLD = 12; // decimal places

function needsRebalancing(index: string): boolean {
  const decimalPlaces = index.split(".")[1]?.length || 0;
  return decimalPlaces > REBALANCE_THRESHOLD;
}

// When rebalancing needed:
// [1500.00000001, 1750.5, 1875.25] → [1000, 2000, 3000]
Rebalancing is O(n), but it happens rarely. The amortized cost per operation stays close to O(1).
Database Implementation
-- Stored as VARCHAR to preserve decimal precision
pack_item_index VARCHAR(20) NOT NULL DEFAULT '0'
VARCHAR instead of DECIMAL because we need exact string representation for the precision check.
Summary
Building a production application with users meant thinking carefully about how data gets stored, queried, and displayed. Each feature required tradeoffs—flexibility vs. simplicity, write efficiency vs. read complexity, normalization vs. performance.
There were plenty of technical challenges throughout building this app. I enjoyed reasoning through the schema decisions and making sure I was building something that scales well and stays extensible. More importantly, these decisions had to support real user workflows—helping people make better decisions about their gear without the data system getting in the way.
You can view the live app at tidytrek.co.