The Question
Hospital emergency departments face capacity challenges that directly impact patient outcomes. When EDs are overcrowded, patients wait longer to be seen, some leave without being seen (LWBS), and quality of care suffers. CMS tracks these metrics publicly.
Primary question: Where are hospitals failing CMS timeliness benchmarks, and what patterns emerge across geography, hospital type, and patient population?
The Data
Source: CMS Hospital Compare (data.cms.gov)
- Timely and Effective Care - Hospital dataset
- Hospital General Information dataset
Scope: 4,052 hospitals with general ED timeliness data across 50 states + DC (3,005 with psychiatric ED data)
Time Period: Q3 2023 - Q2 2024
Data Availability: Psychiatric ED timeliness measures are available for approximately 74% of hospitals reporting general ED timeliness data. Hospitals without psych measures may not offer psychiatric services or may have insufficient volume to report.
Key Measures:
- OP-18b - Median ED time for general patients (minutes)
- OP-18c - Median ED time for psychiatric patients (minutes)
- OP-22 - Left Without Being Seen rate (percentage)
Key Findings
1. National Distribution
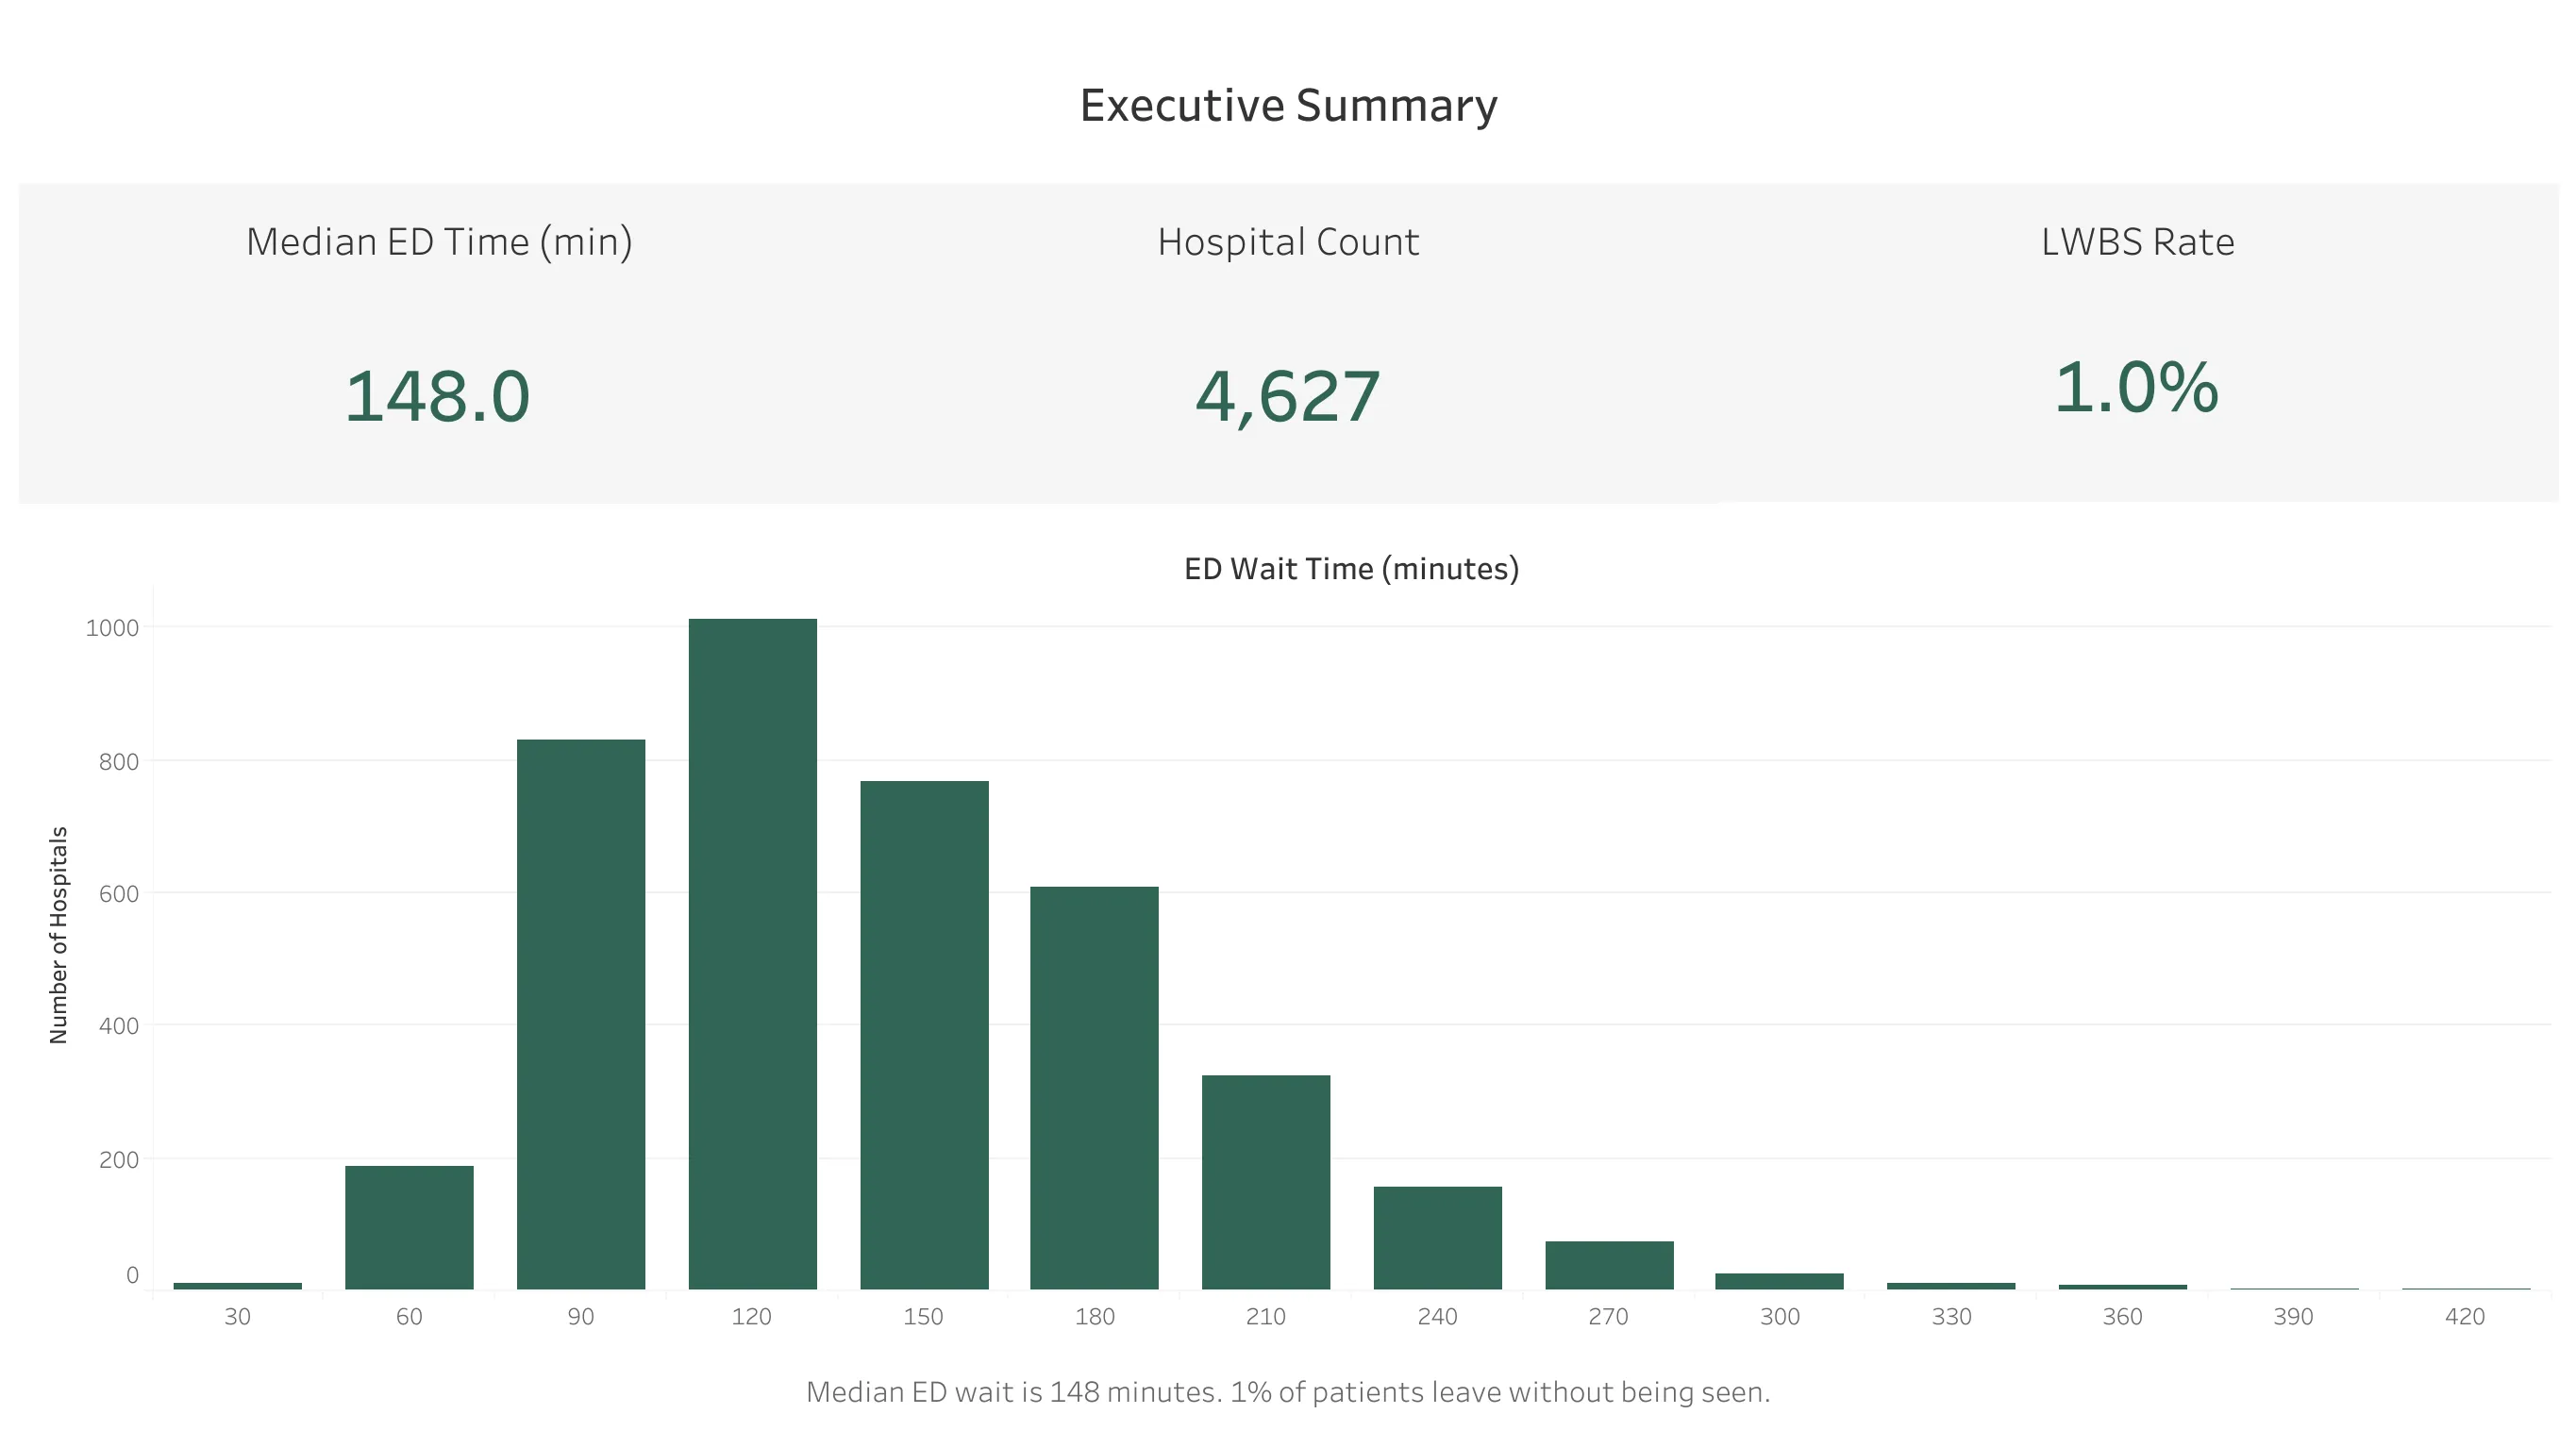
The median ED wait time across all hospitals is 148 minutes (approximately 2.5 hours). The distribution is right-skewed, with most hospitals clustering between 90-180 minutes and a long tail of outliers extending past 400 minutes.
LWBS rate: 1.0% median nationally, meaning 1 in 100 ED patients leaves before being evaluated.
2. Geographic Variation
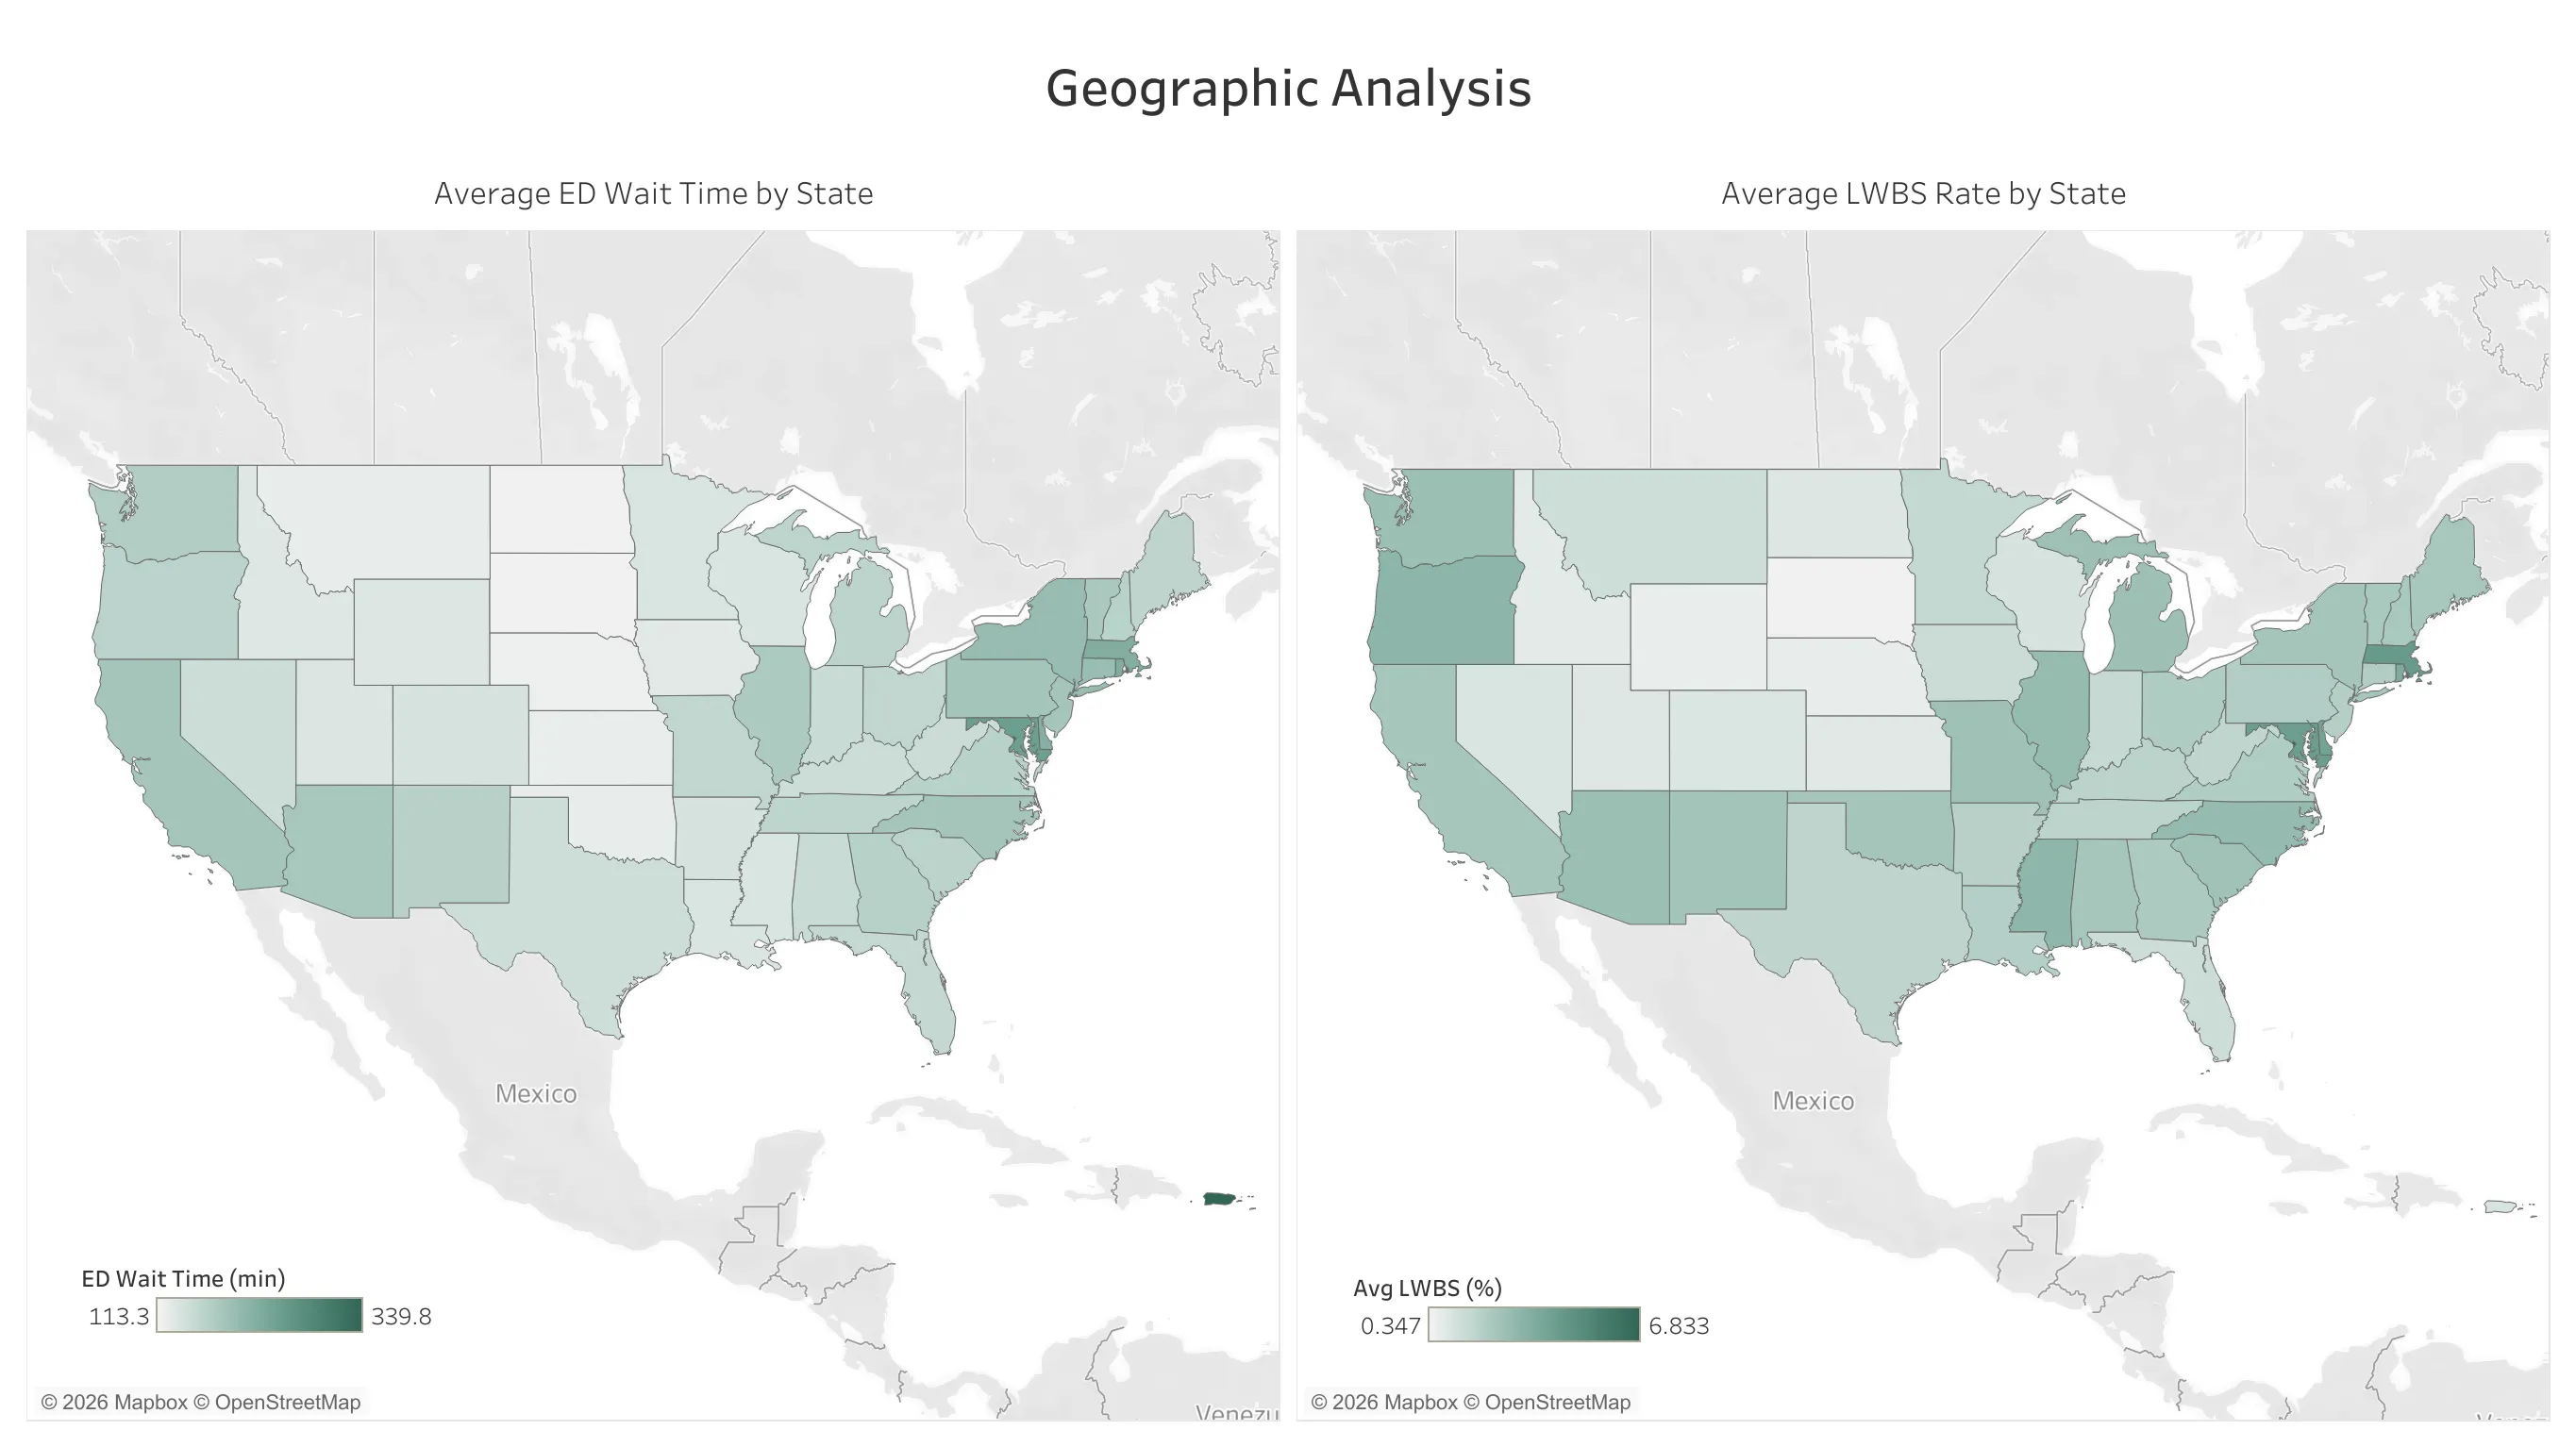
ED performance varies significantly by region:
Longest average wait times: Northeast
- DC: 317 min
- MD: 248 min
- MA: 224 min
Shortest average wait times: Midwest
- SD: 114 min
- ND: 113 min
- NE: 118 min
States with longer ED times also tend to have higher LWBS rates, suggesting broader capacity patterns in certain regions.
3. ED Time and LWBS Correlation
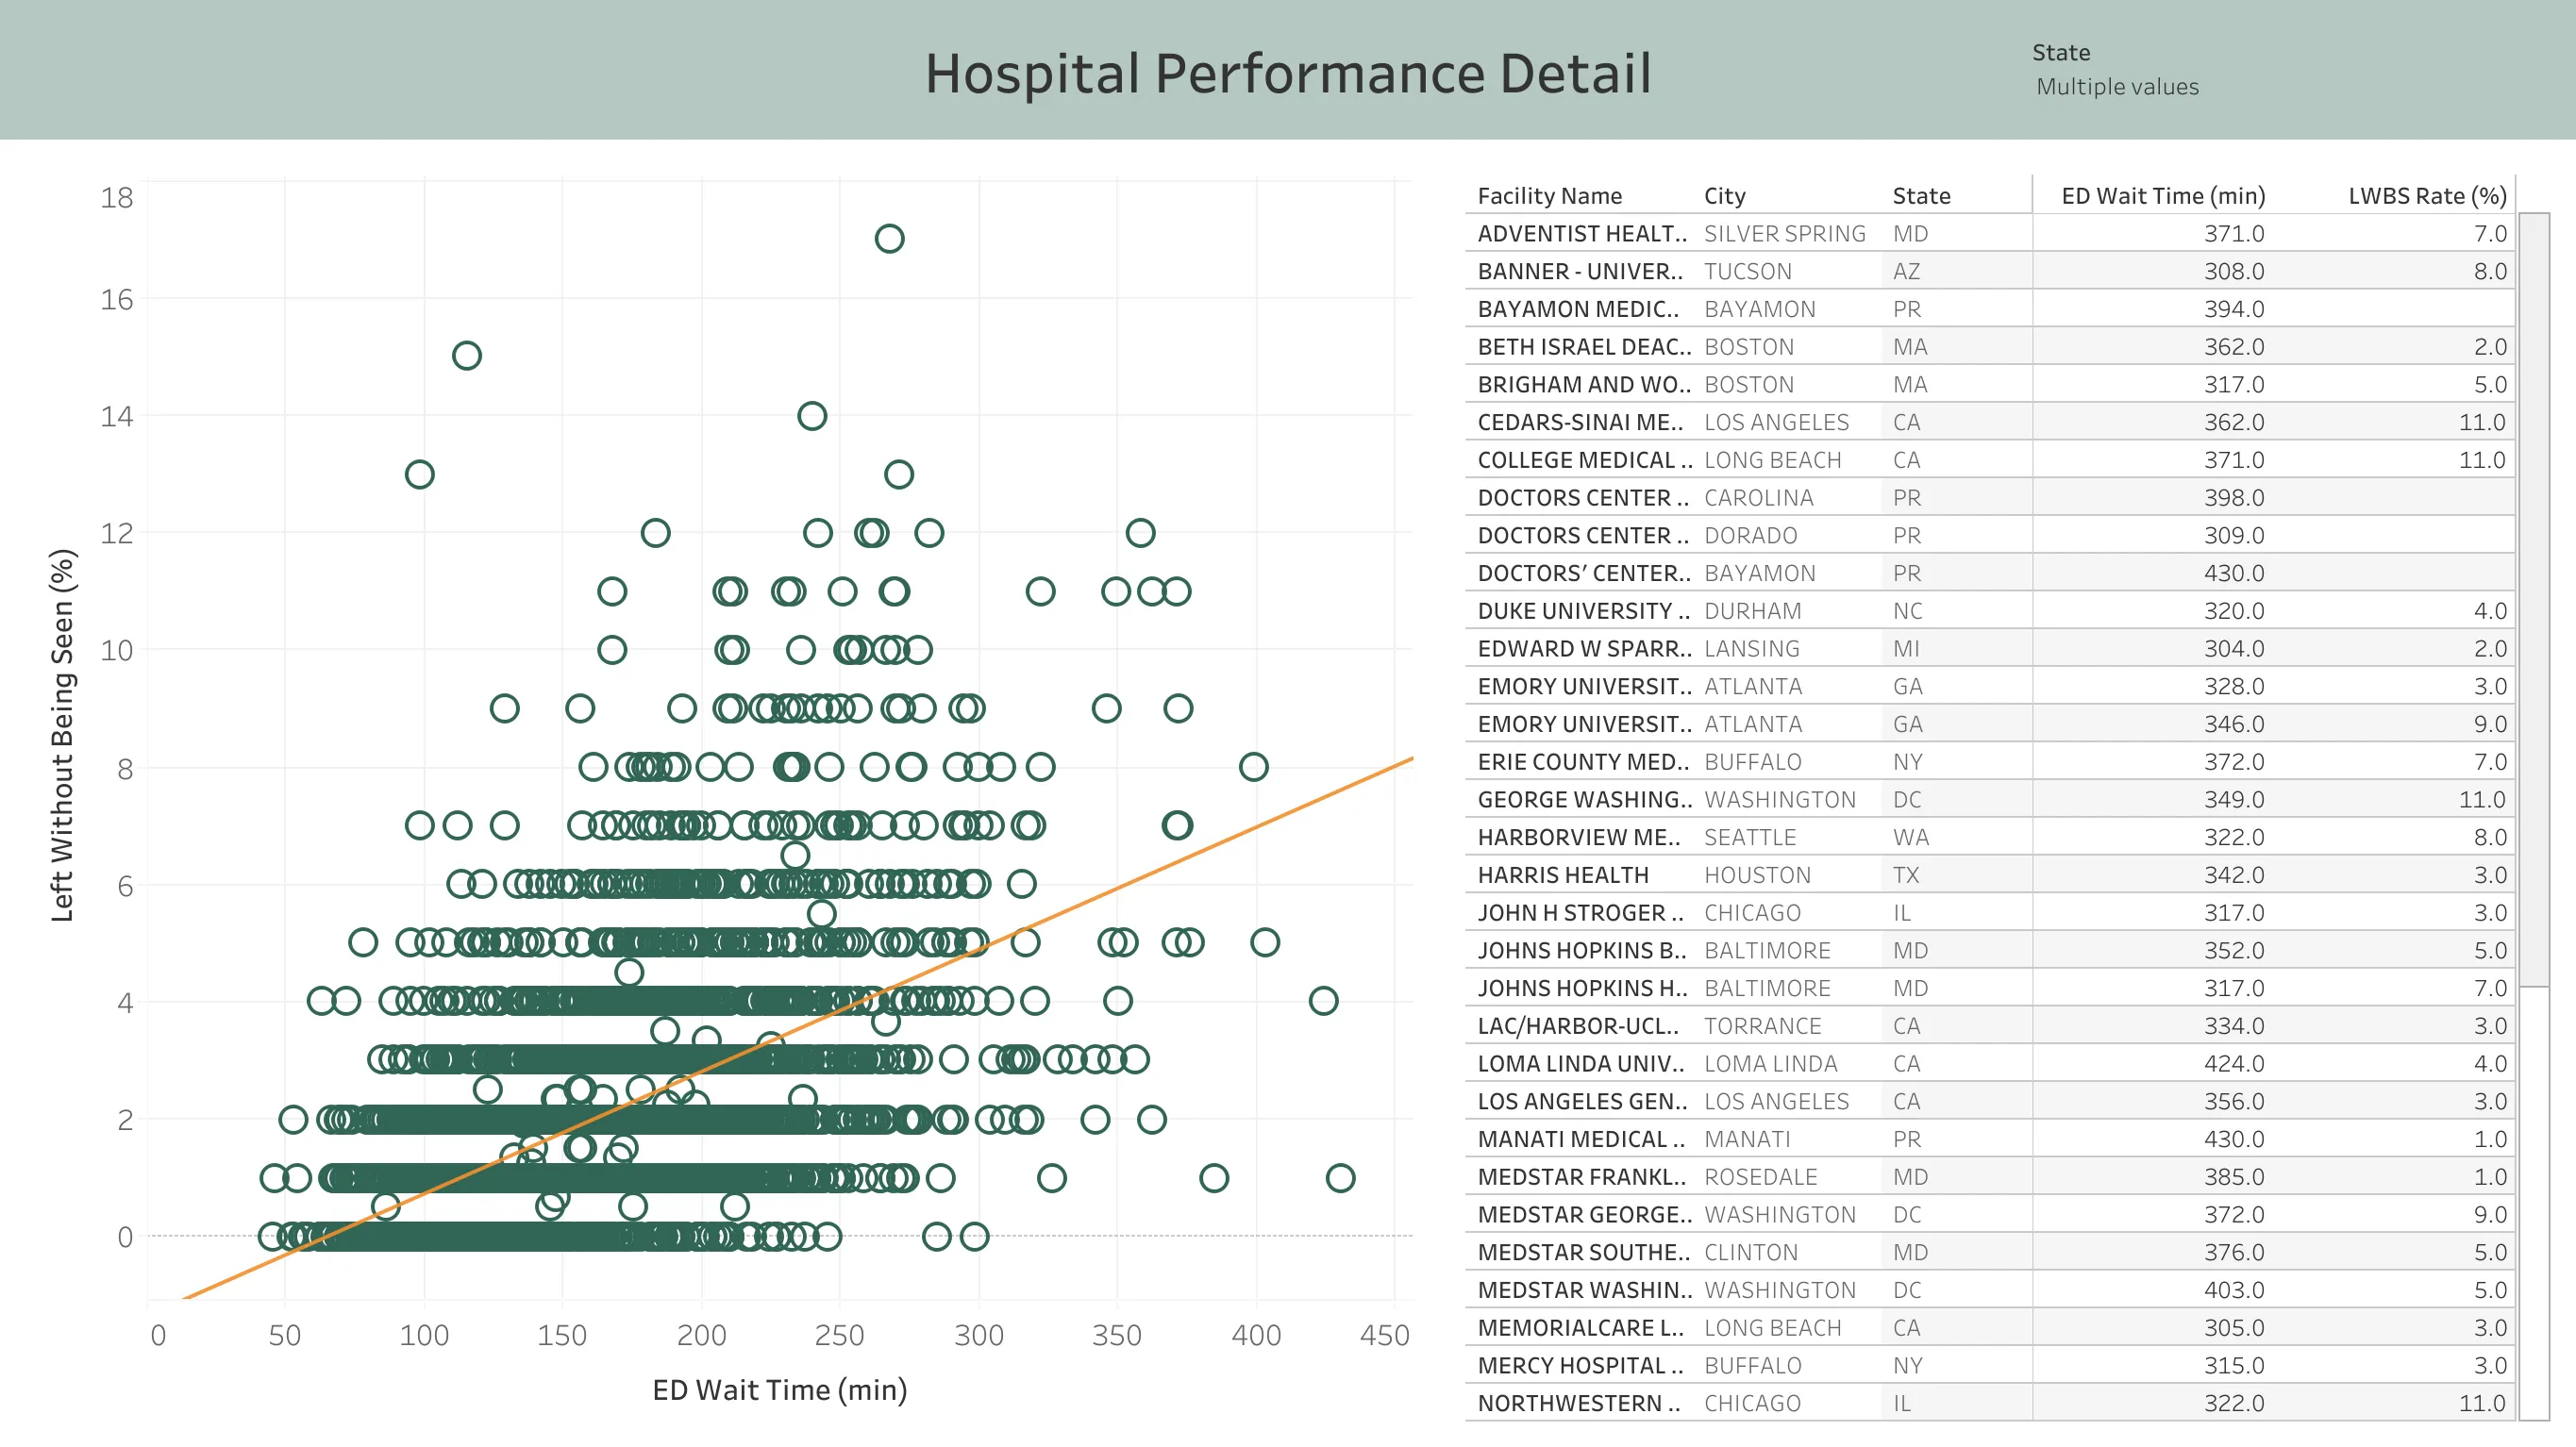
There is a clear positive relationship between ED wait time and LWBS rate at the hospital level. Hospitals with wait times under 2 hours average 0.8% LWBS, while those over 4 hours average 4.7% LWBS.
This makes intuitive sense: patients who are able to leave tend to do so when waits become long.
4. Psychiatric vs General ED Times
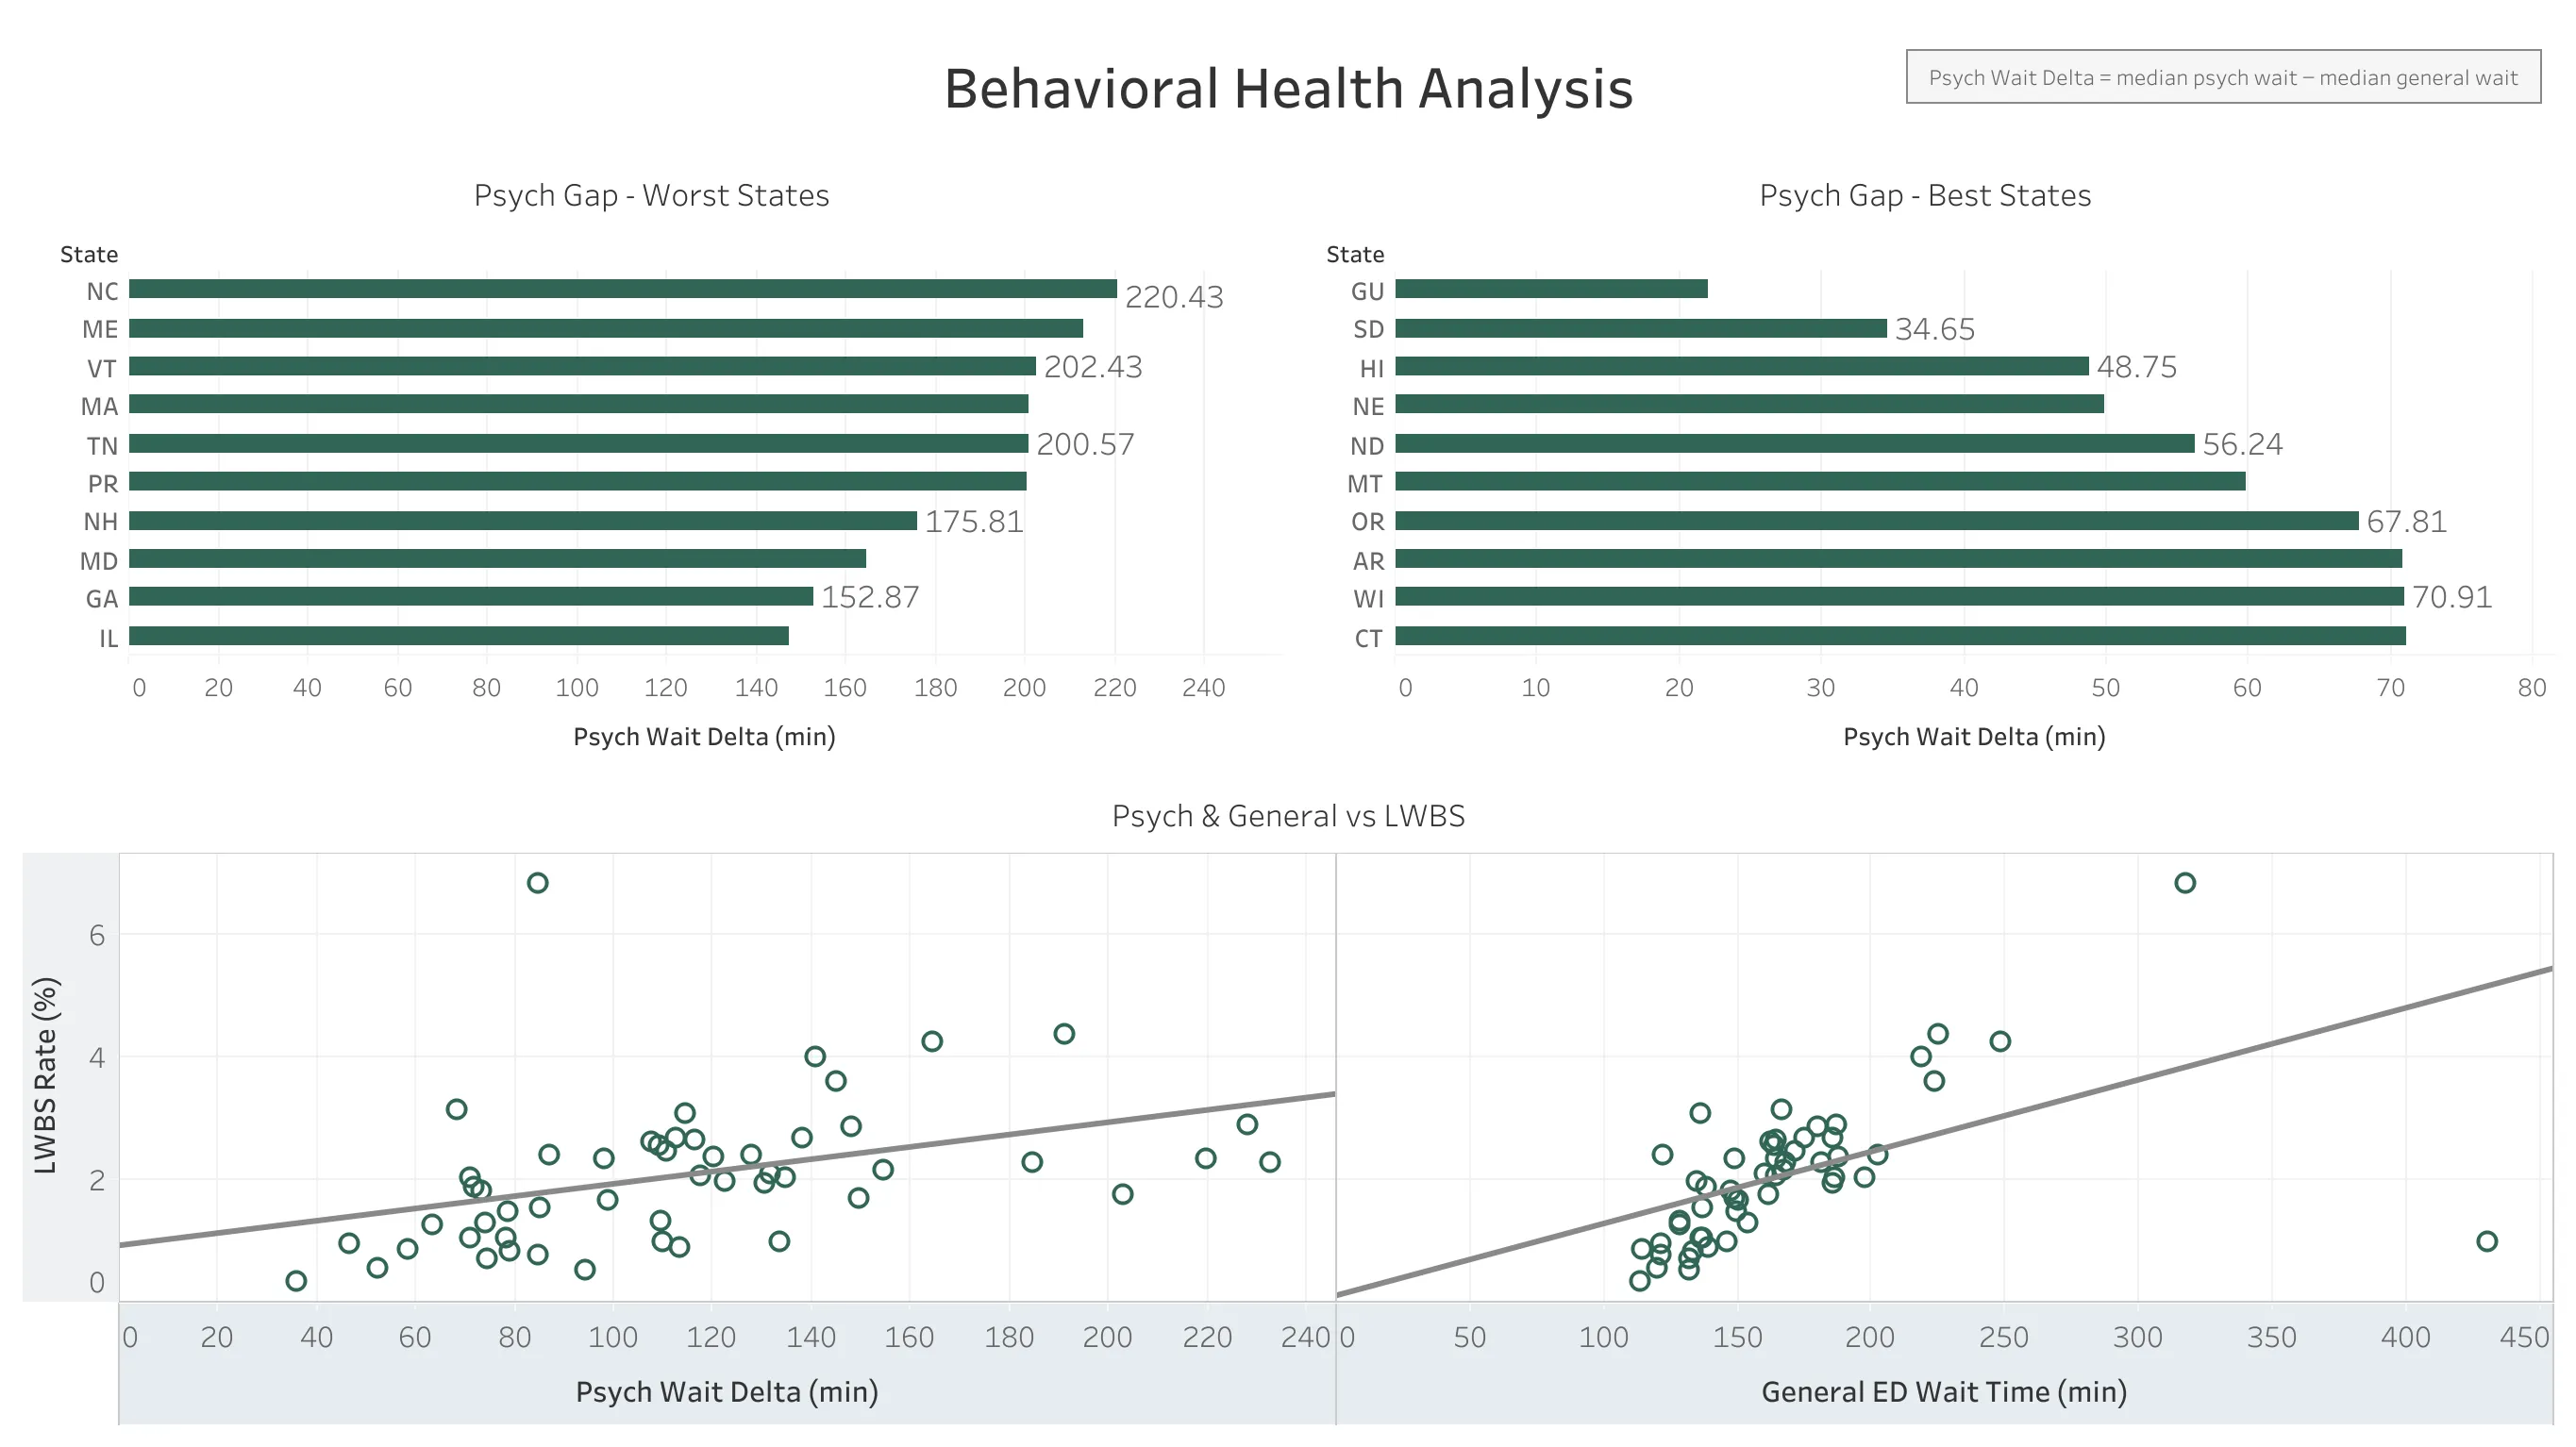
Psychiatric patients wait significantly longer than general ED patients across almost all states:
Largest gaps:
- NC: 220 min longer for psych patients
- ME: 213 min longer
- VT: 202 min longer
Smallest gaps:
- SD: 35 min longer
- HI: 49 min longer
The average psych patient waits 100-150 minutes longer than a general ED patient nationally.
5. LWBS Patterns Differ by Patient Type
When comparing LWBS rates against wait times:
- General patients: Strong positive correlation between wait time and LWBS. Longer waits = more patients leave.
- Psychiatric patients: Weak correlation. Wait time does not predict LWBS as strongly.
This difference may reflect the nature of psychiatric visits, where patients may not be able to leave as easily. LWBS may not capture the full experience for this population.
Observations
Based on the patterns in this data:
-
Geographic clustering is clear. The Northeast has consistently longer wait times than the Midwest/Plains states. This could reflect population density, hospital capacity, or other regional factors.
-
LWBS correlates with wait time for general patients. Hospitals with longer waits see more patients leave, which is an expected pattern.
-
Psychiatric patients wait longer everywhere. The gap between general and psychiatric ED times is consistent across nearly all states, though the size of the gap varies.
-
LWBS may not tell the whole story for psych patients. The weak correlation between wait time and LWBS for psychiatric patients suggests this metric may not capture their experience the same way it does for general patients.
Limitations
- Different hospitals, different patients: Direct comparisons between hospitals may not be fair since they serve different populations.
- Point-in-time snapshot: This is one year of data. Trends over time would tell a richer story, and seasonal variation (flu season, holidays) isn’t captured.
- No staffing data: We can’t correlate wait times with staffing levels.
Methodology
Data Processing:
- Imported CMS CSV files into PostgreSQL
- Used staging tables to handle column filtering and data type conversion
- Created hospital_performance view joining hospital info with pivoted timeliness measures
- Filtered out non-numeric scores (“Not Available”)
- Excluded LWBS outliers >25% as likely data quality issues
Analysis:
- State-level aggregations with median and average calculations
- Z-score outlier identification (>2 standard deviations)
- Calculated field for psych wait delta (psych time - general time)
- Correlation analysis between ED time and LWBS for both patient populations